US ISM Services PMI April Preview: Inflation readings remain key as recovery gains strength
- US service sector continues to fuel economic rebound in US.
- Investors will look for fresh clues on price pressures.
- USD's market valuation remains at the mercy of Treasury bond yields.

The business activity in the US service sector is expected to continue to expand at a record-setting pace in April. The market consensus points to a reading of 64.3 in the Institute for Supply Management’s (ISM) Services PMI in April, stronger than the all-time high set at 63.7 in March.
Commenting on March’s report, “there was a substantial increase in the rate of growth in the services sector in March,” noted Anthony Nieves, Chair of the ISM Services Business Survey Committee. “Respondents' comments indicate that the lifting of coronavirus (COVID-19) pandemic-related restrictions has released pent-up demand for many of their respective companies' services.”
With coronavirus vaccinations in the US continuing at full steam, it wouldn’t be a big surprise to see the service sector preserving its momentum. On a similar note, the IHS Markit’s Flash Composite PMI report revealed that the Services PMI reached a new series high of 63.1 in April.
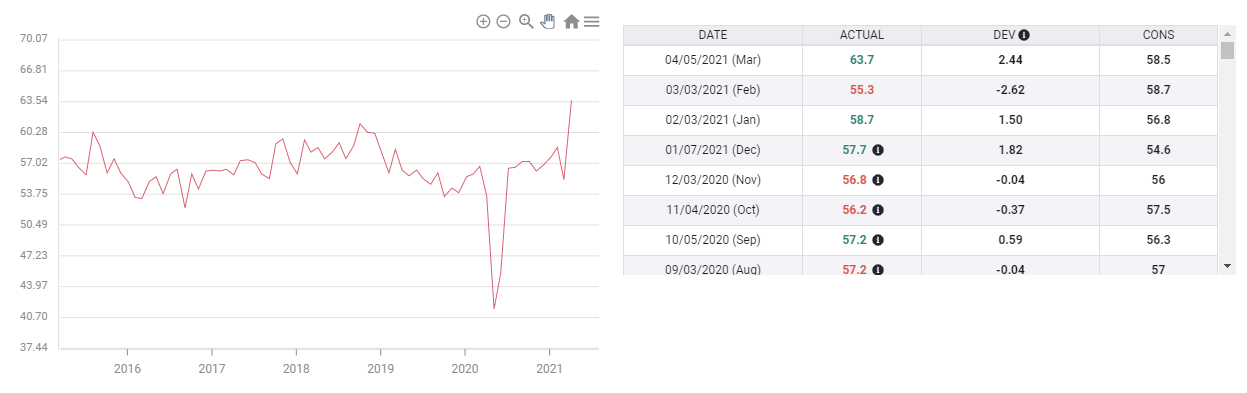
ISM Services PMI
The devil is in the details
Underlying details of the report, especially the ones related to price pressures, will be scrutinized by market participants. The IHS Markit noted that firms continued to pass price increases at a growing proportion to clients in April. Furthermore, “production-capacity constraints, material shortages, weather and challenges in logistics and human resources continue to cause supply chain disruption,” the ISM’s March Services PMI report read.
Following the FOMC’s April policy meeting, at which policymakers voted unanimously to leave the policy settings unchanged, Chairman Jerome Powell acknowledged that it will take time for the supply-side to adapt to a strong surge in demand. “Inflation expectations are now more consistent with Fed's 2% inflation target than pre-pandemic,” Powell added.
On Monday, the Prices Paid Index of the ISM Manufacturing PMI jumped to 89.6 in April from 85.6 in March and recorded an expansion for the 11th consecutive month.
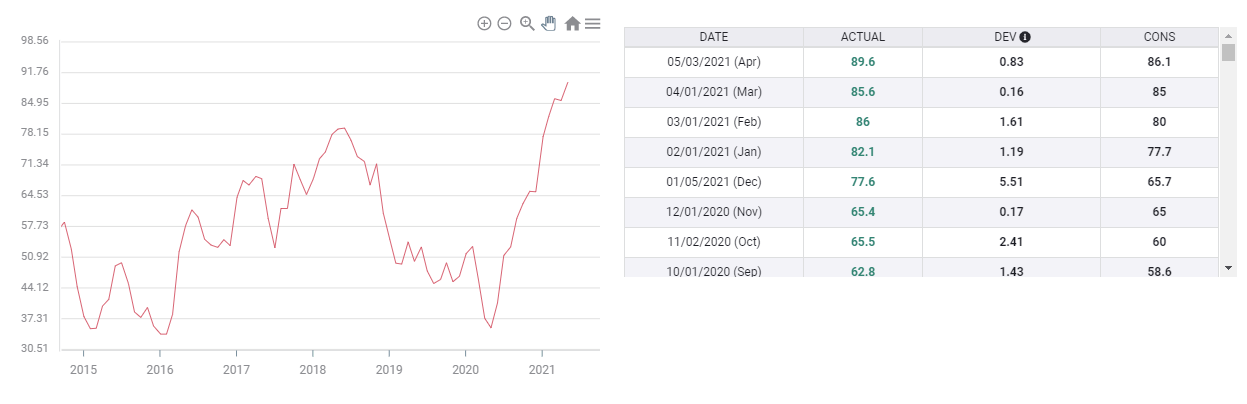
ISM Manufacturing Prices Paid Index
Possible market reaction
Inflation expectations and the US Treasury bond yields’ performance continue to drive the greenback’s performance against its rivals. On Monday, the benchmark 10-year US T-bond yield edged lower despite the above-mentioned inflation reading in the ISM Manufacturing PMI report. With risk flows dominating the financial markets at the start of the week, the US Dollar Index (DXY) lost 0.35% on a daily basis. Nevertheless, the DXY managed to stage a decisive rebound on Tuesday, suggesting that the USD is not having a difficult time attracting investors.
In case the ISM’s Services PMI report highlights that prices continued to increase at a strengthening pace, the greenback could capitalize on rising US Treasury bond yields. On the flip side, an unexpected weakening in inflation pressures in the service sector could trigger a USD selloff as it would suggest that the FOMC will not rush to consider a hawkish shift in its policy outlook.
As one of the most sensitive major currency pairs to sharp fluctuations in the US T-bond yields, USD/JPY could make significant movements after the PMI report.
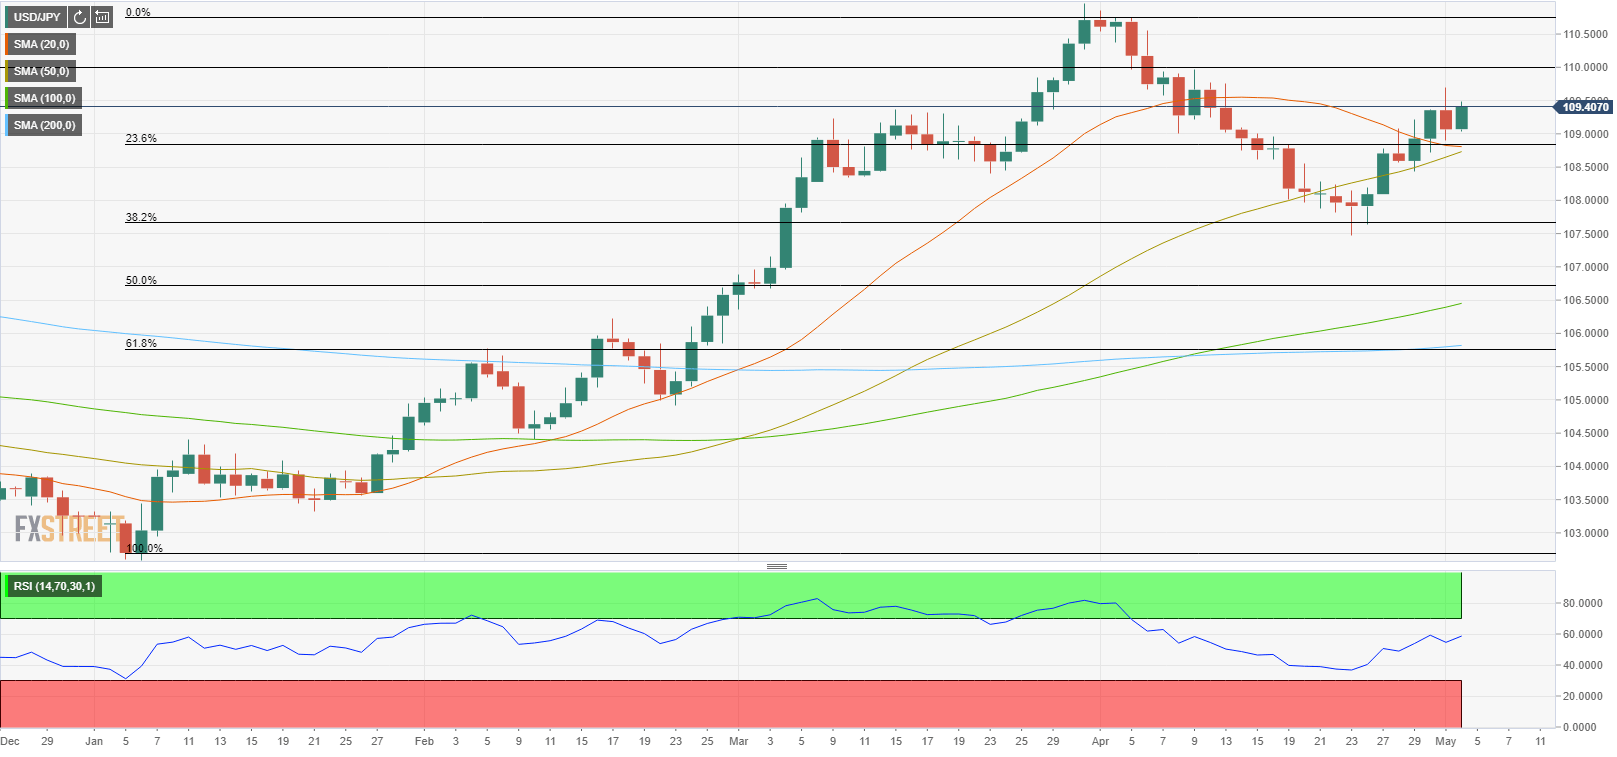
On the upside, the initial resistance is located at 110.00 (psychological level). A daily close above that level could open the door for additional gains toward 110.84 (12-month high set in late March).
On the other hand, a decline in US T-bond yields could drag USD/JPY to 108.85 (Fibonacci 23.6% retracement of January-April uptrend, 20-day SMA, 50-day SMA) ahead of 108.00 (psychological level) and 107.60 (Fibonacci 38.2% retracement).
Author

Eren Sengezer
FXStreet
As an economist at heart, Eren Sengezer specializes in the assessment of the short-term and long-term impacts of macroeconomic data, central bank policies and political developments on financial assets.


