US inflation preview: FXStreet Surprise Index and Trend Indicators both point down – USD to fall?
- Investors and the Federal Reserve will be tuned to June's all-important inflation figures.
- Fed Chair Powell will speak before and after the release, allowing a thorough response.
- FXStreet's Surprise Index is indicating a downside surprise.
- Recent inflation trends are also pointing to a negative outcome.
- Check out the possible trading signal for the US inflation release here

All eyes are on Federal Reserve Chair Jerome Powell and his highly-anticipated testimony on Wednesday. Markets will be tuned to what the world's most powerful central banker has to say. And what is Powell attuned to? The Fed Chair is "data-dependent" and the data speaks on Thursday – with the Consumer Price Index (CPI) report for June.
Price stability is one of the bank's two mandates. We have already received fresh information from the Fed's other mandate – full employment – which has come out significantly above forecasts with 224,000 jobs gained last month.
Will CPI also smash expectations and add to the dollar's strength? Both FXStreet's Surprise Index and the Trend Indicators have been telling a different story.
Before we dive into these potent tools, it is important to note that Powell will have the chance to respond to the data in his second appearance on Capitol Hill, coming some 90 minutes after the figures are out. The timing of testimonies makes the CPI report even more important. However, it also indicates that markets may wait for the Chair's comments – perhaps in an answer to a question by politicians – before moving.
Annual Core CPI is the most important data point and the economic calendar shows that it is projected to remain at 2.0%. Monthly Core CPI is the second most significant figure and an increase of 0.2% is on the cards. The news is due on Thursday, July 11th, at 12:30 GMT.
Negative Surprises
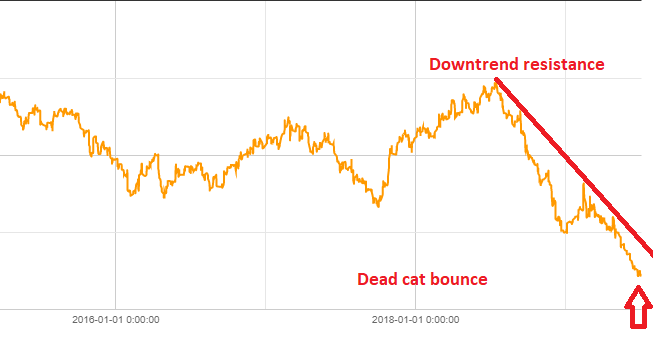
Looking at the long-term trend for top-tier and second-tier figures, we can see that surprises have been trending lower since early in 2019. Disappointments have been getting worse and a downtrend resistance line can be drawn on the index. Recent figures have been unable to remain stable enough to surpass the line just by refraining from further deteriorating.
The recent Non-Farm Payrolls report may have been responsible for a short-term stabilization – yet at low levels and reflecting a "dead cat bounce pattern." – even a dead cat bounces when it falls on the floor. All in all, another downside surprise seems more likely than an upside surprise.
Taking a different look at data points from the recent 18 months which also includes third-tier figures, the picture is also bleak.
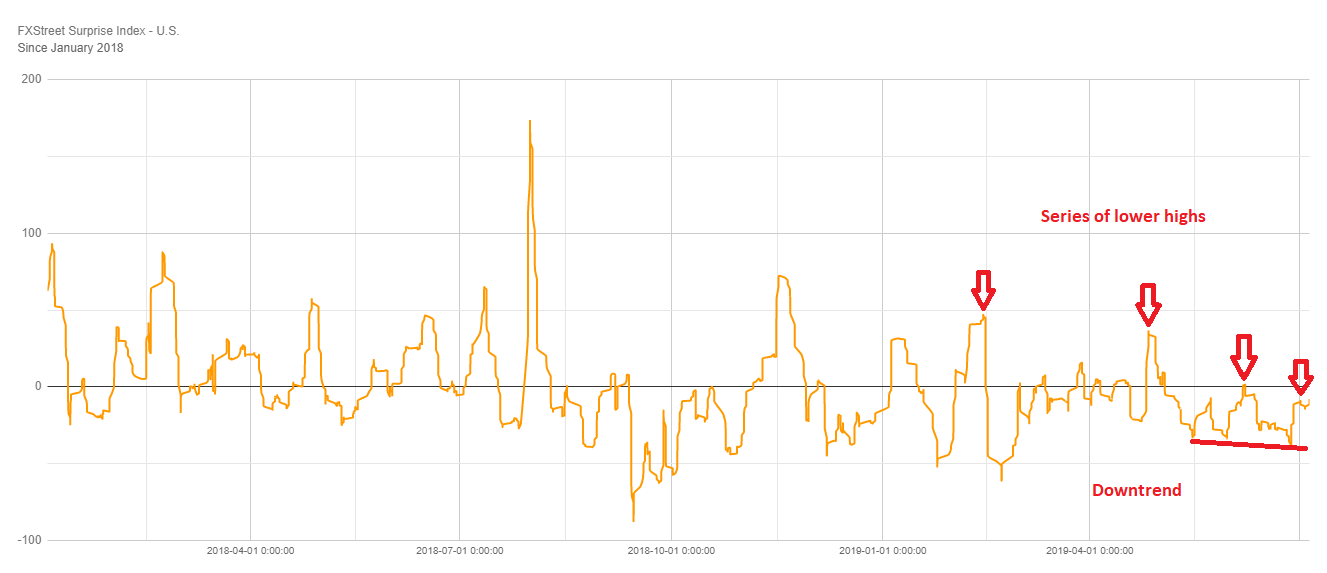
The chart shows a series of four lower highs – a bearish sign. Moreover, recent lows have also been falling, creating downtrend support.
All in all, FXStreet's Surprise Index is pointing to a downfall.
Trend Indicators pointing lower
We shall now move out of the charts – which have involved some technical analysis – to recent economic indicators related to inflation.
| Consumer-related inflation | Impact | Last | Trend | Last 3 | Last 5 | Last 10 |
|---|---|---|---|---|---|---|
| CPI ex Food/Energy YoY | 3 | 2.00% | Down | 2.03% | 2.08% | 2.13% |
| CPI ex Food/Energy MoM | 3 | 0.10% | Down | 0.10% | 0.12% | 0.14% |
| CPI YoY | 2 | 1.80% | Neutral | 1.90% | 1.76% | 2.04% |
| CPI MoM | 2 | 0.10% | Up | 0.27% | 0.20% | 0.15% |
| Core PCE Price Index YoY | 2 | 1.60% | Down | 1.60% | 1.66% | 1.79% |
| Core PCE Price Index MoM | 2 | 0.20% | Neutral | 0.13% | 0.12% | 0.12% |
| PPI ex Food/Energy YoY | 2 | 2.30% | Down | 2.37% | 2.44% | 2.50% |
| GDP Price Index | 2 | 0.60% | Down | 1.33% | 1.90% | 1.89% |
| ISM Prices Paid | 2 | 47.90 | Down | 50.36 | 50.96 | 55.85 |
| Labor-related inflation | Impact | Last | Trend | Last 3 | Last 5 | Last 10 |
|---|---|---|---|---|---|---|
| Average Hourly Earnings YoY | 3 | 3.10% | Neutral | 3.13% | 3.20% | 3.14% |
| Average Hourly Earnings MoM | 2 | 0.20% | Neutral | 0.20% | 0.22% | 0.23% |
| Personal Income MoM | 2 | 0.50% | Neutral | 0.37% | 0.24% | 0.34% |
| Housing-related inflation | Impact | Last | Trend | Last 3 | Last 5 | Last 10 |
|---|---|---|---|---|---|---|
| Housing Price Index MoM | 1 | 0.40% | Neutral | 0.27% | 0.34% | 0.31% |
| Trade-related inflation | Impact | Last | Trend | Last 3 | Last 5 | Last 10 |
|---|---|---|---|---|---|---|
| Import Price Index YoY | 1 | -1.50% | Down | -0.57% | -0.94% | 0.61% |
A quick look at these Trend Indicators already shows that the trend is to the downside.
Starting from the top, both monthly and yearly Core CPI numbers have been trend down. The yearly core PCE Price Index – the Federal Reserve's preferred measure of inflation – is also trending down. The Core Producer Price Index (Core PPI) reflects inflation in the pipeline and it has been on a slippery slope as well. The same applies to import prices – which also feed into future consumer prices.
The inflation component within the Gross Domestic Product (GDP) read – a broad overview of the economy – follows the same negative trajectory. Wages – as recently reported within the jobs report – have been neutral. There is only one positive figure – headline monthly CPI – which is subject to fluctuations in oil prices. The Fed and the markets see through this number.
Additional indicators and further information is availabele at the Consumer Price Index page.
Conclusion – USD may fall but Powell is awaited
As both the Surprise Index and the Trend Indicators show, the chance of a disappointment is higher than a positive surprise.
If annual Core CPI misses with 1.9% or less, the US dollar may be vulnerable to falls. Markets may respond slowly to the news as Powell's second testimony in Congress is awaited. If the figures are indeed weak and Powell expresses concern, the greenback's falls may further extend.
Author

Yohay Elam
FXStreet
Yohay is in Forex since 2008 when he founded Forex Crunch, a blog crafted in his free time that turned into a fully-fledged currency website later sold to Finixio.

















