US inflation key as the dollar remains under pressure

Market Overview
Whether inflation begins to trend higher will be a key issue for traders this year, so any data that helps to build the picture of how inflation is moving will be pounced upon by traders. Last week’s average hourly earnings showed limited upside pressure and did little for the dollar, however yesterday’s US factory gate inflation (the PPI) was weaker than expected on both core and headline basis. This dragged longer dated Treasury yields lower and hit the dollar into the afternoon. It also ramps up the pressure on today’s consumer inflation data, the US CPI. Putting further pressure on the dollar was the revelation in the minutes from the latest ECB Governing Council meeting that there was a prospect of reviewing the guidance of monetary policy in early 2018. This drove speculation that the ECB was another central bank positioning itself for a shift away from ultra-loose monetary policy. The dollar is rapidly losing the first mover advantage of the Fed’s policy tightening. Subsequently we see gold continuing to pull higher, whilst the bull run on Wall Street shows little sign of abating. Overnight we saw China’s trade surplus rising to $54.7bn in December ($37.0bn exp) driven by +10.9% increase in exports (+9.1% exp, +12.3% last) with imports just +4.5% (+13.0% exp, +17.7% last).

Wall Street closed again at all-time highs and towards the highs of the session with the S&P 500 +0.7% at 2767, whilst the Asian markets were generally slightly higher (Nikkei -0.2%) and European markets are rebounding in early moves. In forex, there are mixed moves on the dollar with the euro strength continuing from yesterday’s ECB minutes, but the commodity currencies under a little pressure following the China data. Gold is $6 higher to continue the gains from yesterday, whilst oil is ticking lower for a change, but it is too early to suggest that the price has peaked.
After the US PPI missed to the downside yesterday there will be even more interest given to the US CPI inflation numbers today at 1330GMT. The headline CPI is expected to be +0.2% for the month but wold mean the YoY data drops back to +2.1% (from +2.2% last month), whilst the core CPI is expected to be +0.2% which would maintain the YoY reading at +1.7%. The US Retail Sales (ex-autos) are also at 1330GMT and are expected to be +0.4% for the month. It is also worth watching out for the comments of Bundesbank President Jens Weidmann who is speaking at 1630GMT and is one of the more hawkish members of the ECB’s Governing Council.
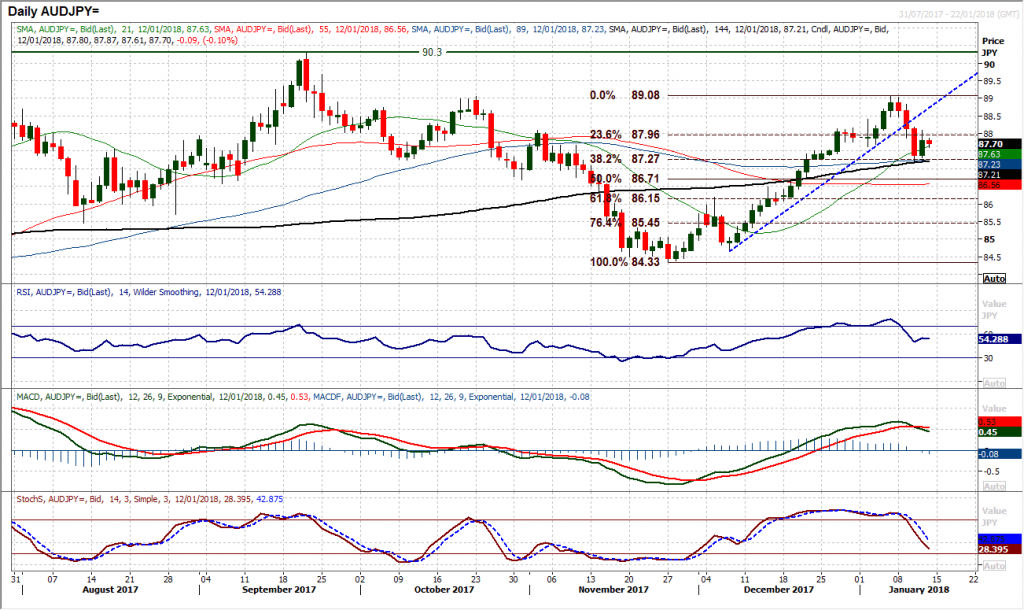
Chart of the Day – AUD/JPY
The rally that kicked in throughout December has seen a marked change of direction as the yen strength in the past week has sent the market into reverse. There has been a string of negative candles that have decisively broken the uptrend but yesterday’s volatile bull candle now leaves the market in an intriguing position. The outlook on momentum looks corrective now with the MACD lines posting the first bear cross since September and the Stochastics also confirming a near term sell signal. However does the bull candle have the capacity to change this outlook? The Fibonacci retracements of 84.33/89.08 would have a say with 38.2% Fib at 87.27 being supportive now and the 23.6% Fib at 87.96 now a basis of resistance. The market failing around the resistance 88.15/88.40 would have been disappointing for the bulls, but the configuration of today’s candle could be key. The early move today suggests the rebound from yesterday has stalled and if the market begins to fall over in the 87.63/88.15 area then another lower high is likely to be formed, continuing the corrective move as reflected in the momentum. The hourly chart configuration shows that rallies are now a chance to sell. A move below 87.20 would open 87.60 which is the 50% Fib level.
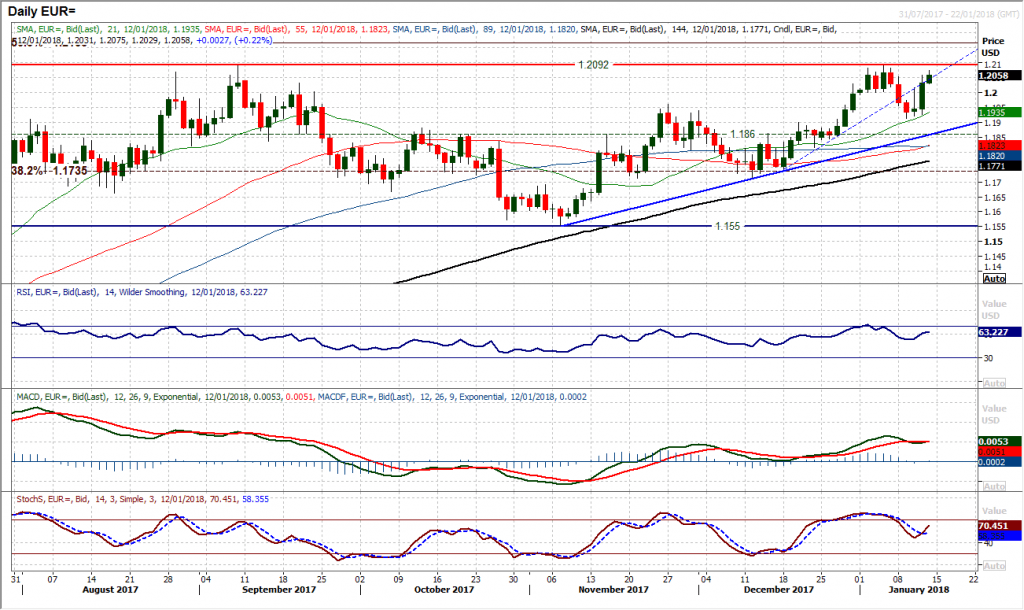
The pair stormed back higher again yesterday amidst euro strength on the back of the hawkish lean in the ECB minutes and the dollar weakness on the back of the disappointing US PPI inflation. This resulted in a solid bullish candle that has bolstered the support at $1.1915 and taken the market decisively back above $1.2000 once more. This means that the $1.2092 resistance is back within reach once more. Technically the momentum indicators are well positioned again with the Stochastics crossing back higher and the RSI back above 60. The hourly chart shows the market is positively configured now for corrections to be bought into, with support around $1.2000/$1.2015. The US CPI data will be the main driver this afternoon and needs to be watched, however in front of that the dollar remains under pressure.
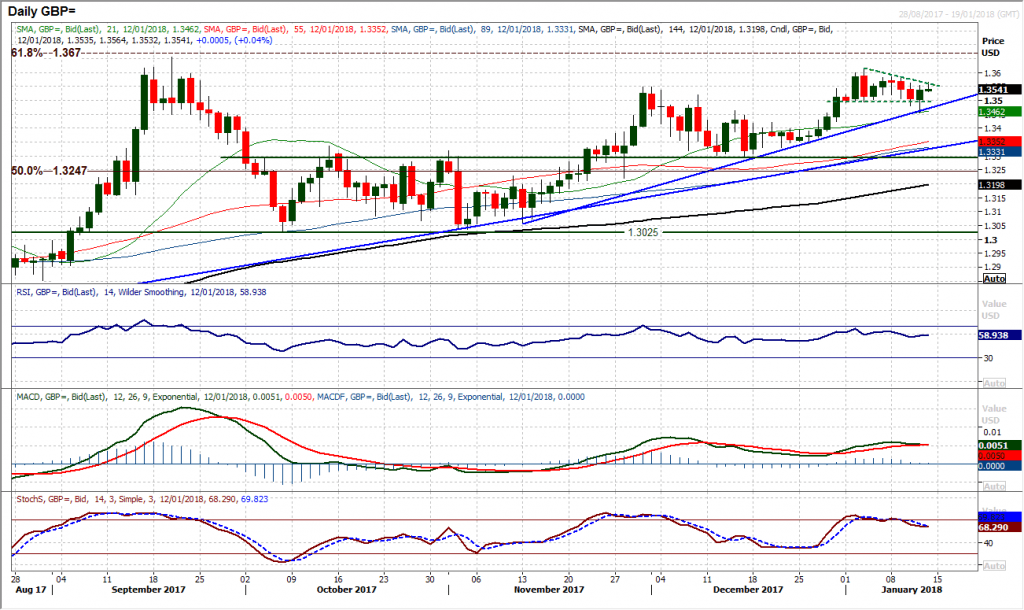
It had increasingly looked as though a corrective slide was underway yesterday, however the weaker than expected US factory gate inflation numbers hit the dollar and the subsequent rebound on Cable has maintained the recent ranging outlook of early 2018. Holding the support of what is coming up to be a nine week uptrend is also helping to bolster the medium term positive outlook. The early move to the upside again today keeps the bulls in control and there will be designs on challenging the initial resistance at $1.3585, whilst the January high of $1.3612 is also within range of a strong session (the Average True Range is currently 72 pips). The reaction higher from $1.3455 means that the corrections on Cable are a chance to buy still. The hourly chart shows a touch of restraint still in the momentum, but there is a minor support band $1.3500/$1.3520 to help.
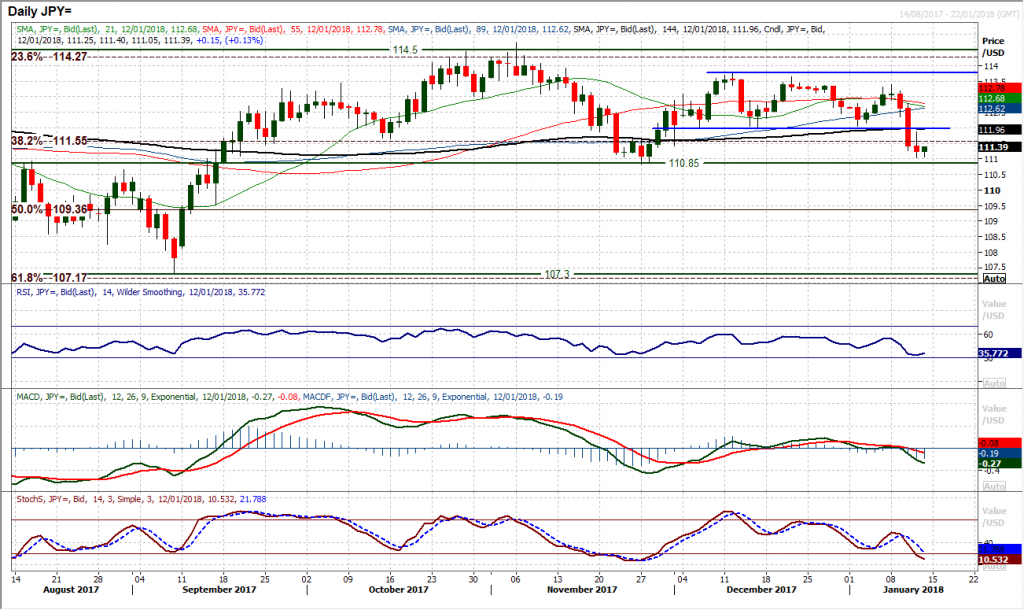
The break below 112.00 was a key near term move and the failure to reclaim this level means that the dollar bulls remain under growing pressure. Yesterday’s bear candle (the third in a row) confirms the breakdown and continues to build the impetus for what could become a test of the key November low at 110.85. The momentum indicators are also building downside drive with the MAD lines now falling decisively below neutral, the Stochastics in forceful decline and the RSI again into the low 30s. The daily chart shows that the low 30s tends to be a bit of a floor in recent months for the RSI so if the indicator drops below 30 then this would be a significant development. For now, intraday rallies remain a chance to sell, with the resistance strong overhead at 111.80/112.00. The hourly chart shows any unwinding moves on the hourly RSI into the 50/60 range is now seen as a chance to sell. Initial support is yesterday’s low at 111.03 however a breach of 110.85 would be a multi-month low and open the way towards 108/109.
Gold
The momentum is building to the upside once more as gold seemingly looks to breakout to the upside again. The market has been in a consolidation over the past week or so but a second consecutive bullish candle was completed yesterday and there have been further gains today to take the market above the $1326.50 resistance to levels not seen since early September. The four week uptrend continues to flank the market higher and is helping to provide the basis of support, coming in currently around $1320 and rising at around $3 per day. Momentum indicators which had been drifting throughout the consolidation phase are also now reacting higher. A close above $1326.50 would be a strong signal that the market was building for continued move to the upside. The initial resistance is around $1334 but there is little real resistance until $1357.50 which is the 2017 high. The hourly chart shows $1315 is initial support protecting $1308.

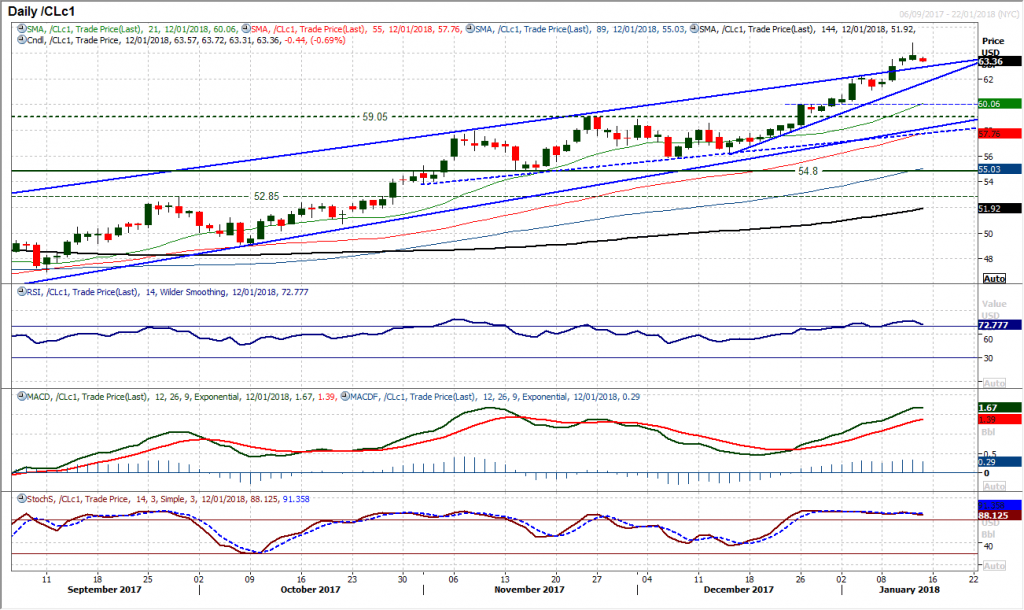
WTI Oil
Once more the bulls did not wait long before piling back into WTI to push the market ever higher to new three year highs. Calling the top in a market that is on such a strong bull run can be a fools game, however are there some signs of a wobble finally from the bulls? The market peaked yesterday at $64.75 and then reversed into the close which was not far from the day low. Whilst not a classic “shooting star” candlestick, the continued dip lower early today will have the bulls questioning their control. This is still very early days as the momentum indicators are still bullishly configured, but long positions ow need to be watched. The hourly momentum could give a warning sign if the hourly RSI drops below 30 and the MACD lines drop decisively below neutral. The initial support is $63.45 and then $62.55.
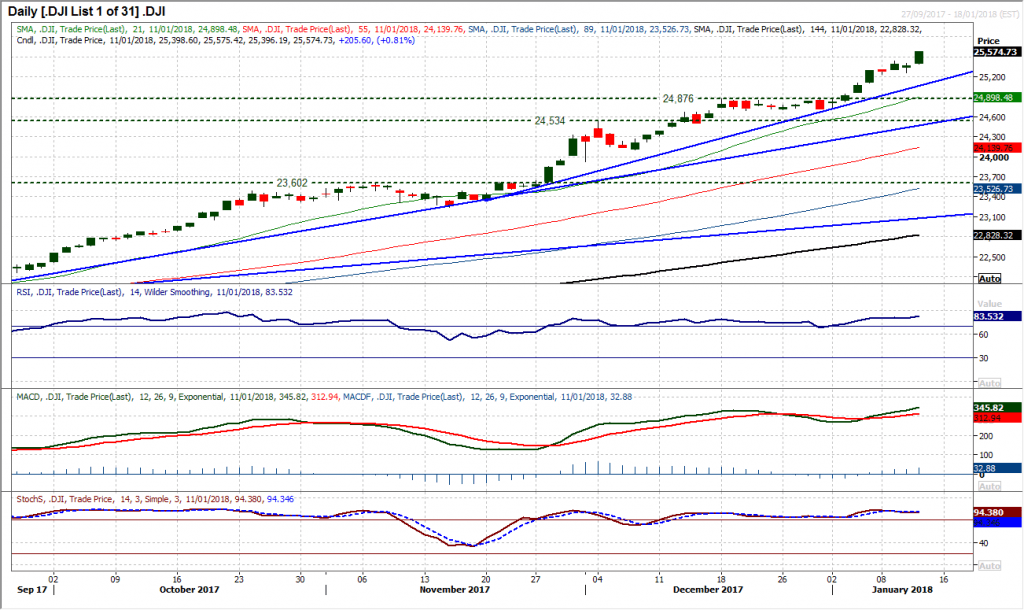
Dow Jones Industrial Average
Wall Street will just not be held back as another minor correction is snapped up again for another all-time high. Another day, another strong bull candle (closing all but at the high of the session) and the bulls are back in control. The move higher has left yet another higher low at 25,257 as the momentum indicators retain a strong positive configuration. Is there a sense of stretched momentum, with the RSI now decisively above 80 and the highest since October. However the Bollinger Bands do not look too stretched as things stand, furthermore, the hourly chart shows the drop back on Wednesday has helped to renew upside potential. Continue to see intraday corrections as a chance to buy. The seven week uptrend support comes in at 25,115 now.
Author

Richard Perry
Independent Analyst


