US Dollar Forecast: The balancing act between the Fed and tariffs
- The US Dollar Index receded to five-month troughs.
- Trump's chaotic trade policy remains on centre stage.
- The Fed is unlikely to change its plans next week.

The US Dollar (USD) remained on the back foot for the second consecutive week, dragging the US Dollar Index (DXY) to fresh five-month lows in the 103.25-103.20 range on March 11. So far, this zone has provided initial support, slowing the sell-off’s momentum.
Adding to the bearish outlook, the index continues to trade below its critical 200-day SMA near the 105.00 mark, keeping the door open for further downside in the near term.
The Greenback’s retreat stood in stark contrast to a modest rebound in US yields across various maturities as investors navigated a complex landscape of shifting tariffs, concerns over a potential United States (US) slowdown, and the uncertain trajectory of Federal Reserve (Fed) policy.
Trade turbulence and price pressures
As expected, US tariffs once again dominated the conversation this week. After a 25% levy on Mexican and Canadian imports went into effect on March 4, President Donald Trump announced just days later that goods from those countries under the United States-Mexico-Canada Agreement (USMCA) would be spared until April 2. Meanwhile, an additional 10% tariff on Chinese imports—bringing the total to 20%—remained intact, and Trump threatened to impose a 200% duty on wine, champagne, and spirits from the European Union (EU) in response to EU tariffs on US whiskey.
It’s important to distinguish between these tariff moves’ immediate and longer-term impacts. Initially, higher import duties can push consumer prices—a “one-off” effect that likely wouldn’t prompt the Federal Reserve (Fed) to alter its policy. However, if such trade measures persist or intensify, they may lead producers and retailers to raise prices further due to reduced competition or in pursuit of higher profits. This second-round effect could dampen demand, slow economic activity, affect employment, and even reintroduce deflationary risks—factors that might eventually force the Fed to take stronger action.
Economic outlook in question
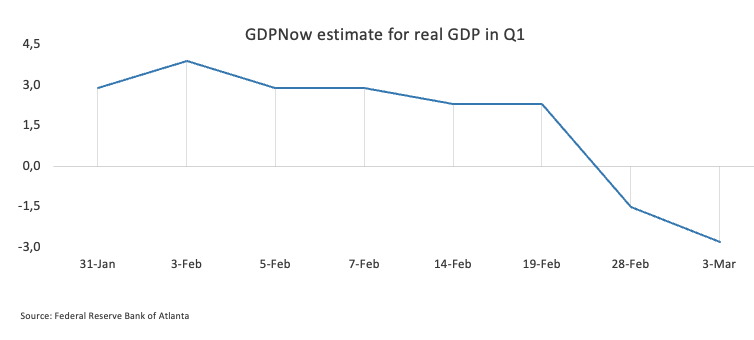
The US Dollar’s ongoing decline has fueled growing speculation about a potential slowdown in economic activity. This sentiment has been bolstered by recent lackluster data and a dip in market confidence.
Despite inflation persistently overshooting the Fed’s 2% target—according to both Consumer Price Index (CPI) and Personal Consumption Expenditures (PCE) data—the labor market seems to be cooling at a slower pace than anticipated, adding another layer of complexity to the overall economic picture.
The Fed keeps its prudent stance
Market consensus suggests that the Fed will keep interest rates steady in the 4.25%–4.50% range at its March 19 meeting, maintaining the “hawkish hold” stance from January 29. Even with a relatively optimistic economic outlook, policymakers have acknowledged “somewhat elevated” inflation levels, implying that potential headwinds may still be ahead—especially given the ongoing trade policy uncertainties.
During his semi-annual testimony before Congress, Fed Chair Jerome Powell highlighted that there is no pressing need for further rate cuts, citing strong economic growth, historically low unemployment, and persistent inflation above the 2% target. Recent remarks from Fed officials reveal a balanced view: growth is expected to continue, but several uncertainties may influence future policy decisions.
Looking ahead for the Greenback
All eyes now turn to next week’s Federal Open Market Committee (FOMC) meeting and the updated “dots plot,” which should offer further insights into the central bank’s plans for the coming months.
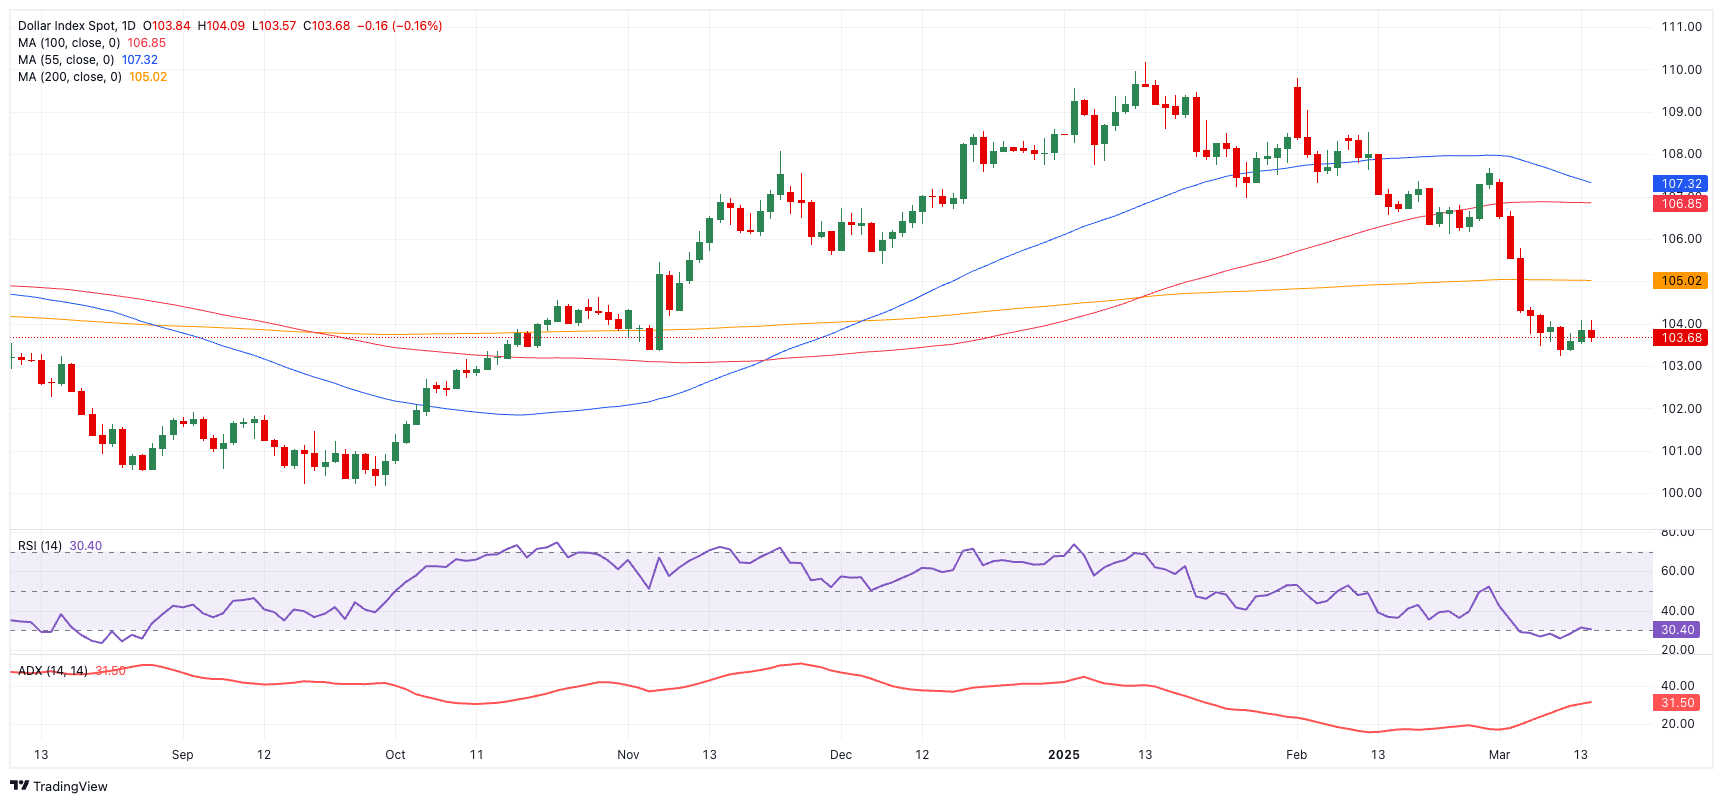
Technical view: US Dollar Index (DXY) dynamics
On the technical side, the US Dollar Index (DXY) has slipped below its key 200-day Simple Moving Average (SMA), reinforcing a bearish outlook. Meanwhile, oversold conditions might trigger a short-term rebound if buyers step in.
If sellers continue to dominate, support could first be found at the 2025 bottom of 103.22 (March 11), followed by the 2024 bottom at 100.15 (September 27)—all preceding the critical 100.00 level.
Conversely, any recovery might push the index toward the key 200-day SMA at 104.97, prior to the interim 100-day and 55-day SMAs at 106.76 and 107.31, respectively. Further up lies the weekly high of 107.66 (February 28), with further resistance at the February top of 109.88 (February 3) and the year-to-date peak of 110.17 (January 13).
DXY daily chart
Fed FAQs
Monetary policy in the US is shaped by the Federal Reserve (Fed). The Fed has two mandates: to achieve price stability and foster full employment. Its primary tool to achieve these goals is by adjusting interest rates. When prices are rising too quickly and inflation is above the Fed’s 2% target, it raises interest rates, increasing borrowing costs throughout the economy. This results in a stronger US Dollar (USD) as it makes the US a more attractive place for international investors to park their money. When inflation falls below 2% or the Unemployment Rate is too high, the Fed may lower interest rates to encourage borrowing, which weighs on the Greenback.
The Federal Reserve (Fed) holds eight policy meetings a year, where the Federal Open Market Committee (FOMC) assesses economic conditions and makes monetary policy decisions. The FOMC is attended by twelve Fed officials – the seven members of the Board of Governors, the president of the Federal Reserve Bank of New York, and four of the remaining eleven regional Reserve Bank presidents, who serve one-year terms on a rotating basis.
In extreme situations, the Federal Reserve may resort to a policy named Quantitative Easing (QE). QE is the process by which the Fed substantially increases the flow of credit in a stuck financial system. It is a non-standard policy measure used during crises or when inflation is extremely low. It was the Fed’s weapon of choice during the Great Financial Crisis in 2008. It involves the Fed printing more Dollars and using them to buy high grade bonds from financial institutions. QE usually weakens the US Dollar.
Quantitative tightening (QT) is the reverse process of QE, whereby the Federal Reserve stops buying bonds from financial institutions and does not reinvest the principal from the bonds it holds maturing, to purchase new bonds. It is usually positive for the value of the US Dollar.
Premium
You have reached your limit of 3 free articles for this month.
Start your subscription and get access to all our original articles.
Author

Pablo Piovano
FXStreet
Born and bred in Argentina, Pablo has been carrying on with his passion for FX markets and trading since his first college years.


