US Dollar Weekly Forecast: GDP, PCE data to test recent strength as Fed enters blackout period
- The USD Index (DXY) clinched its third weekly gain in a row.
- Higher US yields across the curve underpinned the Greenback.
- Fedspeak, data pushed back bets for rate cuts.

The march north in the US Dollar (USD) remained unabated in past sessions, this time advancing for the third straight week, including a new yearly top in the USD Index (DXY) around the 103.70 zone.
Diminishing bets for Fed rate cuts, data supported the upside momentum
The US Dollar started the week on a strong footing despite Monday’s inactivity following the Martin Luther King holiday. As the week progressed, encouraging prints from the US economic docket, including Retail Sales, the Philly Fed Manufacturing Index, and weekly Initial Jobless Claims, all lent extra legs to the USD Index (DXY), lifting it to new 2024 peaks in the 103.65-103.70 band.
The recovery in the Greenback came pari passu with the strong bounce in US yields across the curve, all in response to declining bets on the likelihood that the Federal Reserve (Fed) might start trimming its fed funds target rate as soon as in March.
The unabated resilience of the US economy, coupled with the pick-up in inflation figures in December and the persevering strength of the domestic labour market, prompted Fed officials to start playing in favour of an interest rate cut, but later than anticipated, something that remains well at odds with investors’ belief.
Supporting the above, FOMC Governor Christopher Waller said the timing of interest rate cuts this year will be up to deliberations on the Fed policy-setting panel, but that he would not want to start until they were "relatively convinced" that inflation was sustainably near the Fed's 2% goal. In the same line, Atlanta Fed President Raphael Bostic expressed his willingness to consider implementing interest rate reductions before July if there is "compelling" evidence of inflation decelerating at a faster pace than initially projected. While reiterating the plan to commence rate cuts in the third quarter, he emphasized the significance of exercising prudence to avoid premature reductions that could potentially reignite demand and price pressures.
Focus shifts to Q4 GDP, PCE
A glimpse at the upcoming set of data releases in the US highlights the publication of flash Manufacturing and Services PMIs for January, along with another revision of the GDP Growth Rate for the October-December period, while weekly prints from the labour market should also keep investors entertained. So far, the continuation of stronger-than-expected results from key fundamentals is expected to keep the buck well bid and remains a source of potential extra gains for the DXY in the relatively short-term horizon amidst the start of the Fed’s “blackout” period on January 20.
DXY Technical Outlook
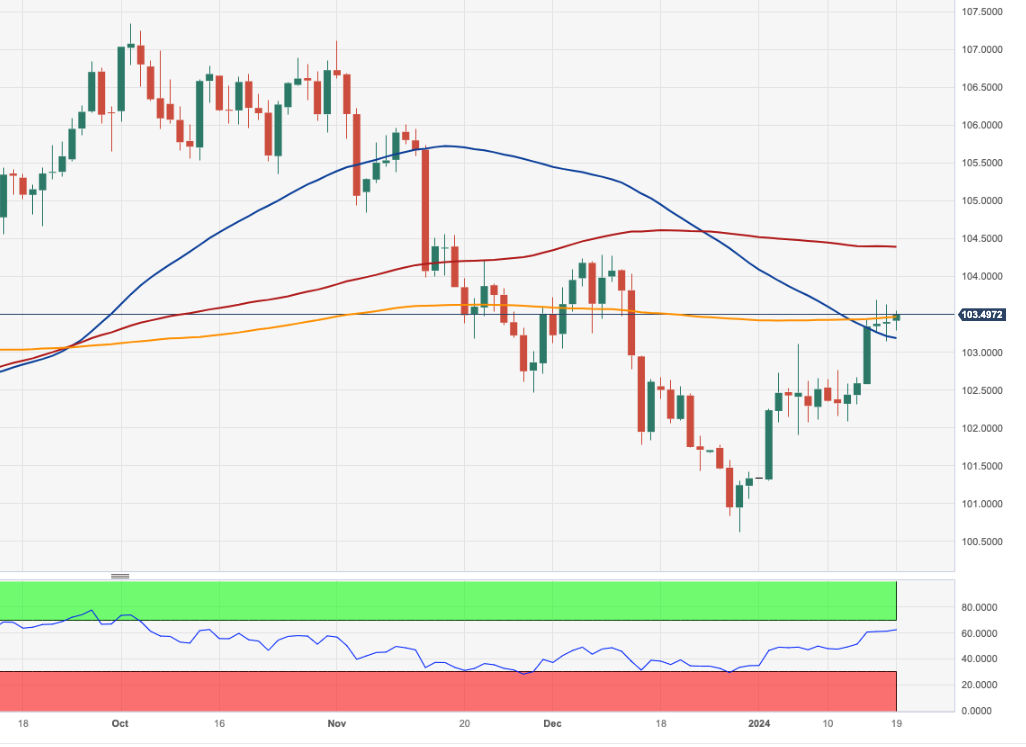
Analyzing the daily chart of the DXY index, we can observe that immediate resistance is anticipated around the year-to-date high of 103.69 (January 17). This level is somewhat reinforced by the proximity of the critical 200-day Simple Moving Average (SMA) at 103.46. Further ahead, we find the December peak of 104.26, (December 8 and 11), just before encountering the transitory 100-day SMA at 104.39. If the index surpasses this level, it may pave the way for a move towards the November peak of 107.11 (November 1), after clearing the minor resistance at the weekly high of 106.10 (November 10).
However, if sellers regain control and manage to dampen the ongoing recovery, there is no significant support zone until the December low of 100.61 (December 28). If this level is breached, the index could potentially embark on a downward trajectory towards the psychological 100.00 threshold prior to the 2023 bottom of 99.57 (July 14).
US Dollar price this week
The table below shows the percentage change of US Dollar (USD) against listed major currencies this week. US Dollar was the strongest against the New Zealand Dollar.
| USD | EUR | GBP | CAD | AUD | JPY | NZD | CHF | |
| USD | 0.67% | 0.58% | 0.50% | 1.71% | 2.19% | 2.25% | 1.90% | |
| EUR | -0.67% | -0.09% | -0.16% | 1.06% | 1.58% | 1.62% | 1.25% | |
| GBP | -0.56% | 0.12% | -0.07% | 1.15% | 1.65% | 1.73% | 1.36% | |
| CAD | -0.51% | 0.16% | 0.08% | 1.21% | 1.74% | 1.76% | 1.41% | |
| AUD | -1.74% | -1.06% | -1.14% | -1.23% | 0.53% | 0.56% | 0.19% | |
| JPY | -2.24% | -1.56% | -1.78% | -1.73% | -0.49% | 0.07% | -0.30% | |
| NZD | -2.28% | -1.61% | -1.70% | -1.79% | -0.54% | -0.02% | -0.35% | |
| CHF | -1.91% | -1.24% | -1.33% | -1.41% | -0.17% | 0.35% | 0.38% |
The heat map shows percentage changes of major currencies against each other. The base currency is picked from the left column, while the quote currency is picked from the top row. For example, if you pick the Euro from the left column and move along the horizontal line to the Japanese Yen, the percentage change displayed in the box will represent EUR (base)/JPY (quote).
Author

Pablo Piovano
FXStreet
Born and bred in Argentina, Pablo has been carrying on with his passion for FX markets and trading since his first college years.