US dollar continues to run strongly after Yellen speech

Market Overview
The economic data releases from last week (FOMC minutes and Retail Sales) and a key speech from Fed Chair Janet Yellen have merely helped to re-emphasise that the Federal Reserve will be moving towards its next rate increase in December. Despite some arguable mixed messages in Yellen’s speech the dollar strength on track and the early moves today show that this continues. Although Yellen seemed to advocate looser for longer (no real surprise there) there was still nothing really in the speech to suggest that a December hike was in doubt. The dollar index remains around 7 month highs, with the euro fell to its lowest since late July and the dollar bulls are still in the driving seat. Interestingly, after Yellen’s speech looked to suggest allowing the economy and inflation to run hotter, the 10 year Treasury yields continue to strengthen. However it is interesting that whilst equities had previously been reacting positively to positive data, the gains are now becoming harder to find. The outlook is fairly mixed today with Asian markets following a flat close on Wall Street on Friday, whilst European markets are also slightly weaker today.

In forex markets there is a slightly mixed outlook with the yen weaker, whilst the euro has just looked to edge slightly higher after a big sell-off into the close on Friday. There is also a decent showing from the Kiwi today. Gold and silver have also recovered some lost ground from Friday. Oil is trading marginally lower.
Traders will be looking for the final Eurozone inflation reading for September at 1000BST (+0.4% headline CPI expected and a core of +0.8%). Then attention turns to the US again with the New York Fed manufacturing at 1330BST +1.1 exp) whilst Industrial Production is at 1415BST (+0.3% MoM exp) with capacity utilization expected to show a mild improvement (75.6% exp).
Lucky 8 – FX Trader of the Year 2016 competition update
I am now moving on to look at a new set of Lucky 8 instruments for Week 3 of our competition that we are running throughout October. I will be giving daily updates on how the Lucky 8 instruments of the week are performing.
-
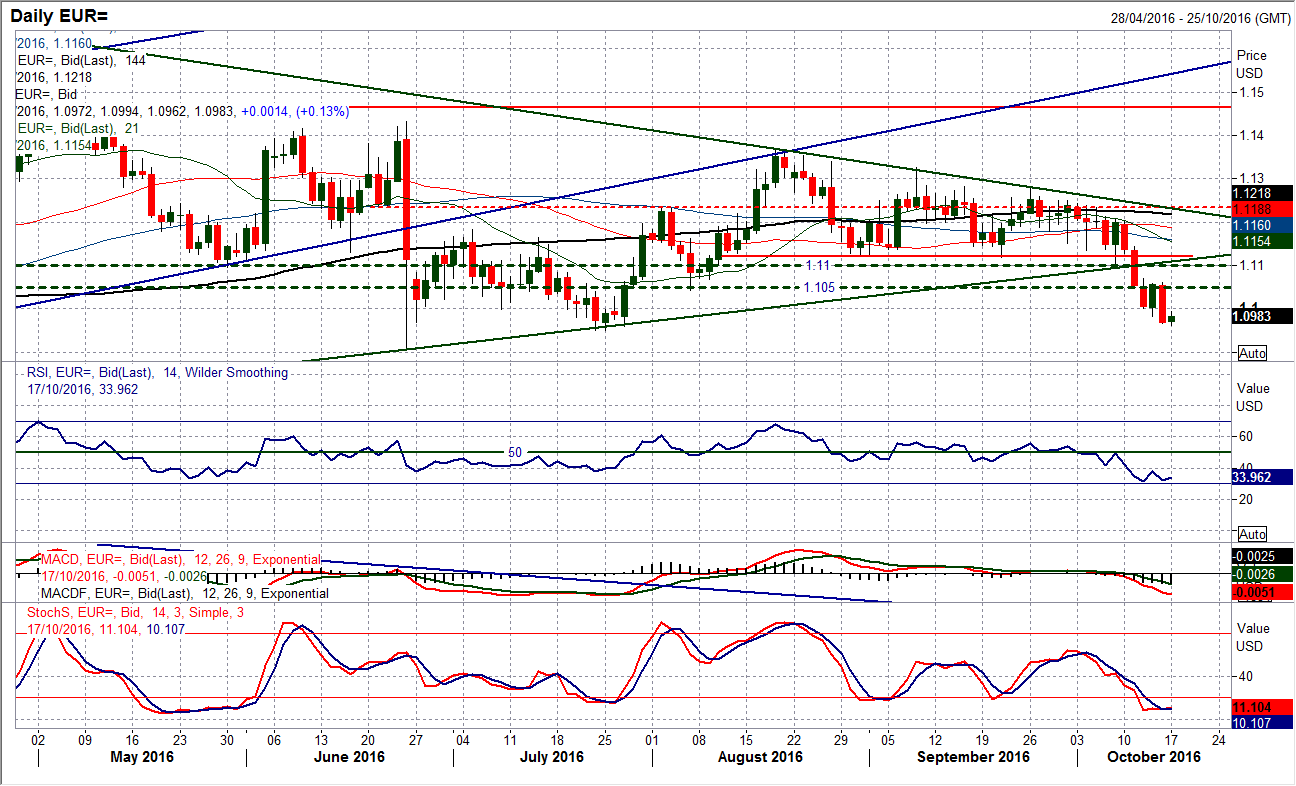
EUR/USD – The bears remain in control and rallies are being sold into. The bounce today is unwinding a near term stretched position with resistance around $1.1100, $1.1027 and more importantly around $1.1060. Expect pressure on $1.0950. (See below for more detail).
-
USD/CAD – The medium term range has been maintained as a 5 week uptrend has been broken. This comes after Thursday’s bearish engulfing candle and a break of support at 1.3135. The hourly chart is also more corrective now with resistance 1.3180/1.3220. Expect pressure on 1.3100.
-
EUR/JPY – The medium term outlook is neutral and the market is still lacking direction after a series of neutral candles last week. A close below 113.90 would be a near term break, whilst the hourly chart shows a little rectangle consolidation 113.90/115.15 that if broken implies a projection of 125 pips.
-
CAD/JPY – The improvement continues with a near term breakout above key near term resistance at 78.90 to open the September high at 80.28. Strong near term technical back the continued recovery and there is now a basis of support 78.50/78.90 to use for a chance to buy.
-
USD/TRY – Is the rally slowing? A number of neutral candles last week suggests that the bulls are still preferred but there is now an uncertainty to the run higher. Support at 3.0865 becomes key now as a breach would open downside. The hourly chart shows a slight bull bias but an emerging neutral outlook. Resistance at 3.1130.
-
DAX – Can the DAX sustain the upside recovery. Previous attempts to gain traction in the past few months have failed at lower levels which means that the early sessions this week could be key to the outlook. The resistance band 10,692/10,705 will be key. The hourly chart reflects a range play and this would mean watching for potential key corrective hourly candles for a potential trigger for another retracement.
-
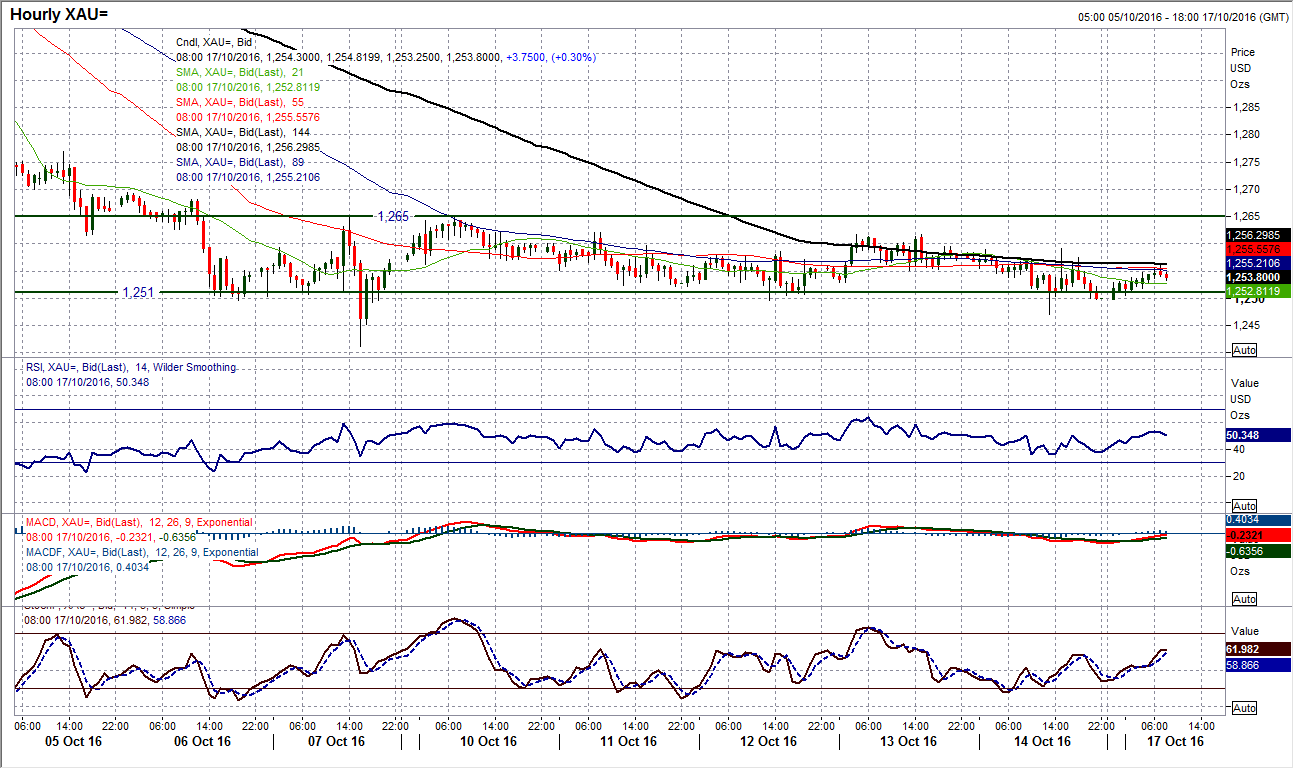
Gold – The market needs a breakout to remove the consolidation. Support at $1247 protects $1241 whilst $1265 protects the near term key level at $1277. A break of either extreme level would drive a move in the direction of the break. (See below for more detail).
-
Wheat (WZ6 or W#_Z16) – Wheat has finally started to gain bull traction on the beak above 412. This now implies an upside recovery target of 434, a move that would also open the August high around 449. Momentum is increasingly strong and with upside potential, intraday corrections are a chance to buy.
EUR/USD
The bearish outlook continues to drag the euro lower for the near term and a move back towards a test of $1.0950 remains likely. Friday’s strong bear candle wiped out all of Thursday’s recovery gains and saw the bears resume full control. The momentum indicators are firmly in bearish configuration with the RSI in the low 30s but also showing further downside potential in this run lower, whilst the Stochastics are also negatively configured. The hourly chart shows that there has been an early rebound today as the stretched position unwinds but I continue to expect rallies to be sold into and there is now a band of near term resistance between $1.1000/$1.1060 in which I would expect to see the next lower high. A breach of $1.0950 would open $1.0910 but also the key support around $1.0800.
GBP/USD
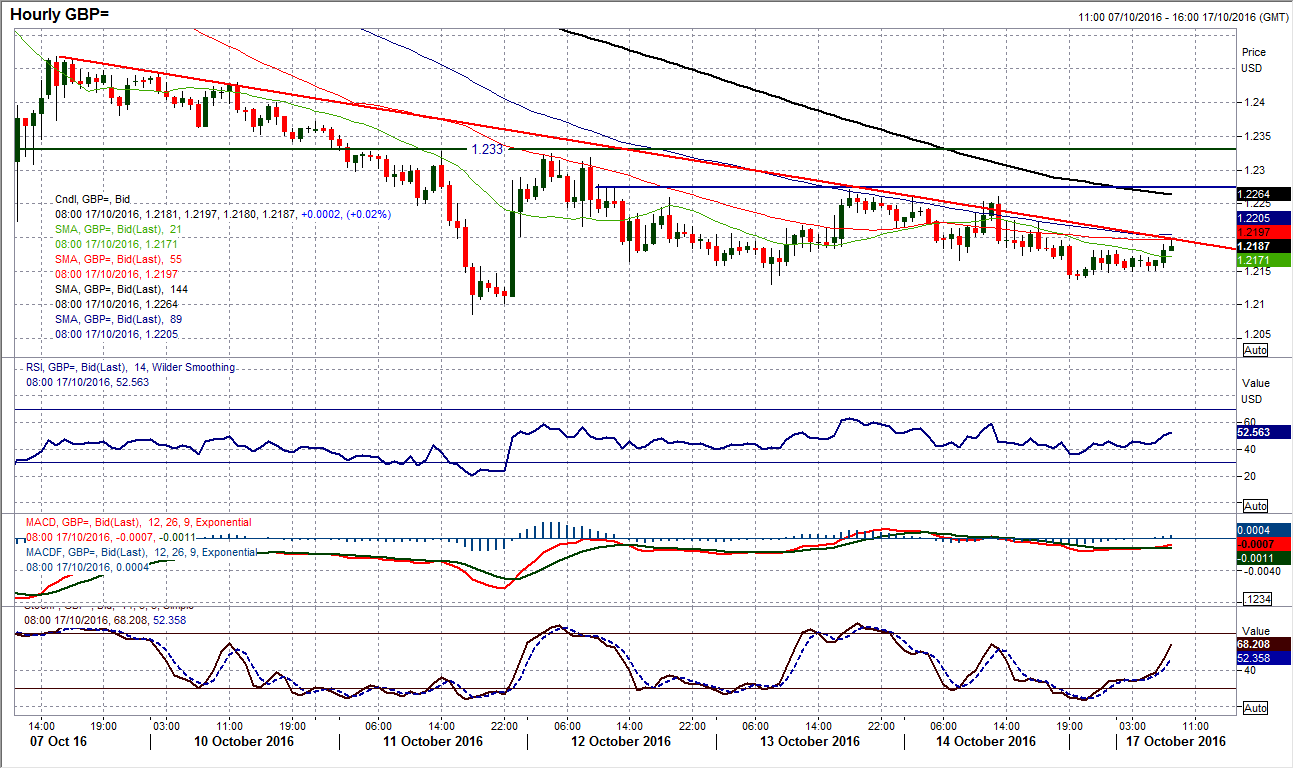
The longer term technical on Cable remain bearish but the support at $1.2086 has been intact for several days now. The volatility in the chart is just beginning to calm down slightly and it will be interesting to see if the drift lower that has come with a downtrend in the past week continues. On Friday the downtrend was threatened but continued in the wake of the better than expected US Retail Sales. The drift lower has resumed and at the moment all technicals are pointing towards further weakness and a test of $1.2086 with negative configuration on the hourly momentum indicators and trading below the hourly moving averages. However watch out for the hourly downtrend as a breach would be a sign of support forming. The bulls would though need traction above $1.2270 to really embark upon a recovery. Continue to play the short side but with caution that the bears are not as aggressive as they were previously.
USD/JPY
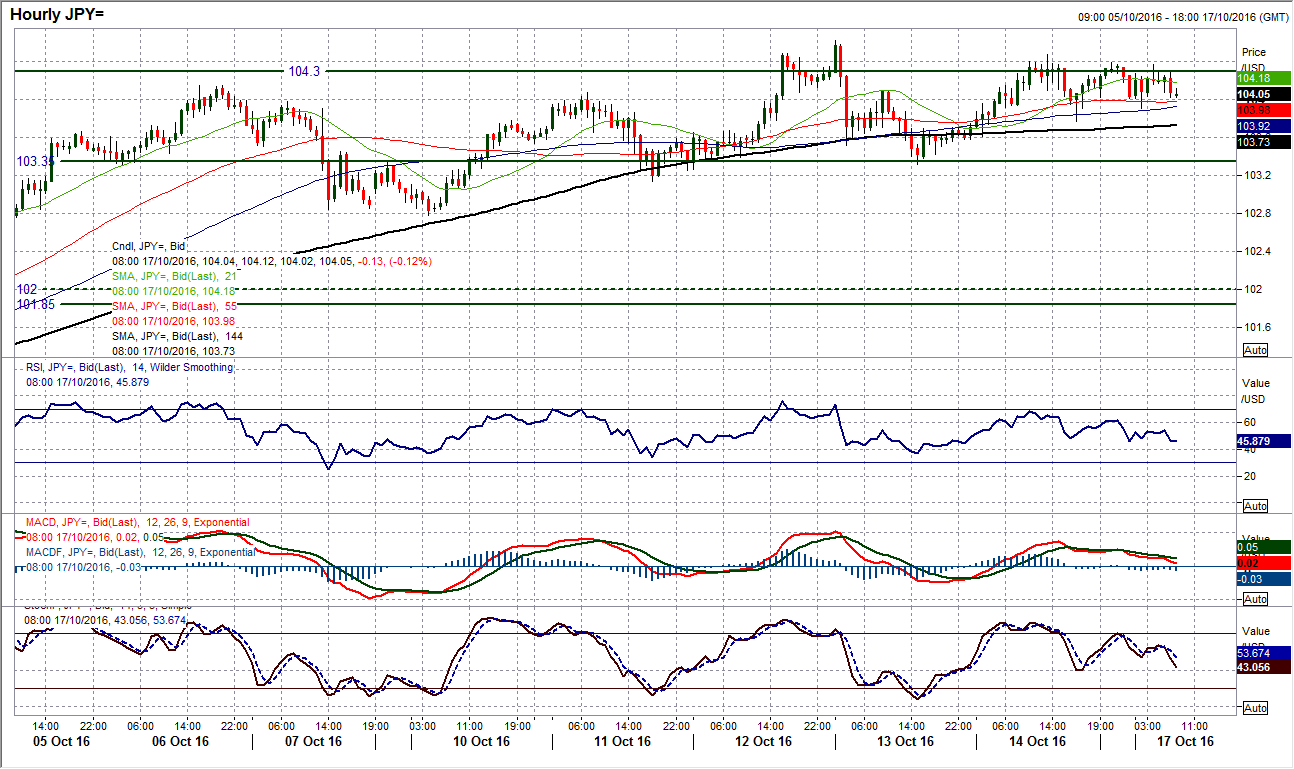
The bulls are in control but there is more of a slow and considered look to the pressure now. The momentum indicators remain positively configured with the RSI around 60, Stochastics holding above 80 and the MACD lines rising above neutral. However there have now been several candles that have moved above the old resistance at 104.30 but each has failed to close above to really stamp home the bullish authority. Despite this the support is holding and there is support that has formed above the pivot at 103.35 on the hourly chart. I still expect the bulls to breakout but the move is slower than I had hoped. I am a buyer into weakness but would be more concerned below 103.35 with the ley near term support at 102.80.
Gold
After a week of doing very little, can gold start to find direction once more? An $18 range for the week was extremely dull/subdued, however it means that the potential breakout levels are close now. The support at $1241 is key, whilst the $1247 low from Friday is now a near term gauge. The early rebound of a few dollars today is doing little to drive direction and the momentum indicators remain subdued. The RSI looks to be close to pulling back above 30 but in this instance I remain sceptical that this could be considered a buy signal especially with the Stochastics flat now (you would expect the sensitive Stochastics to be leading a recovery). The overhead resistance at $1260 and $1265 is capping the recovery prospects and I prefer short positions towards $1241 for an eventual $1225 and possibly $1200, however the market seems to be in need of a near term catalyst now. Key near term resistance is $1277.
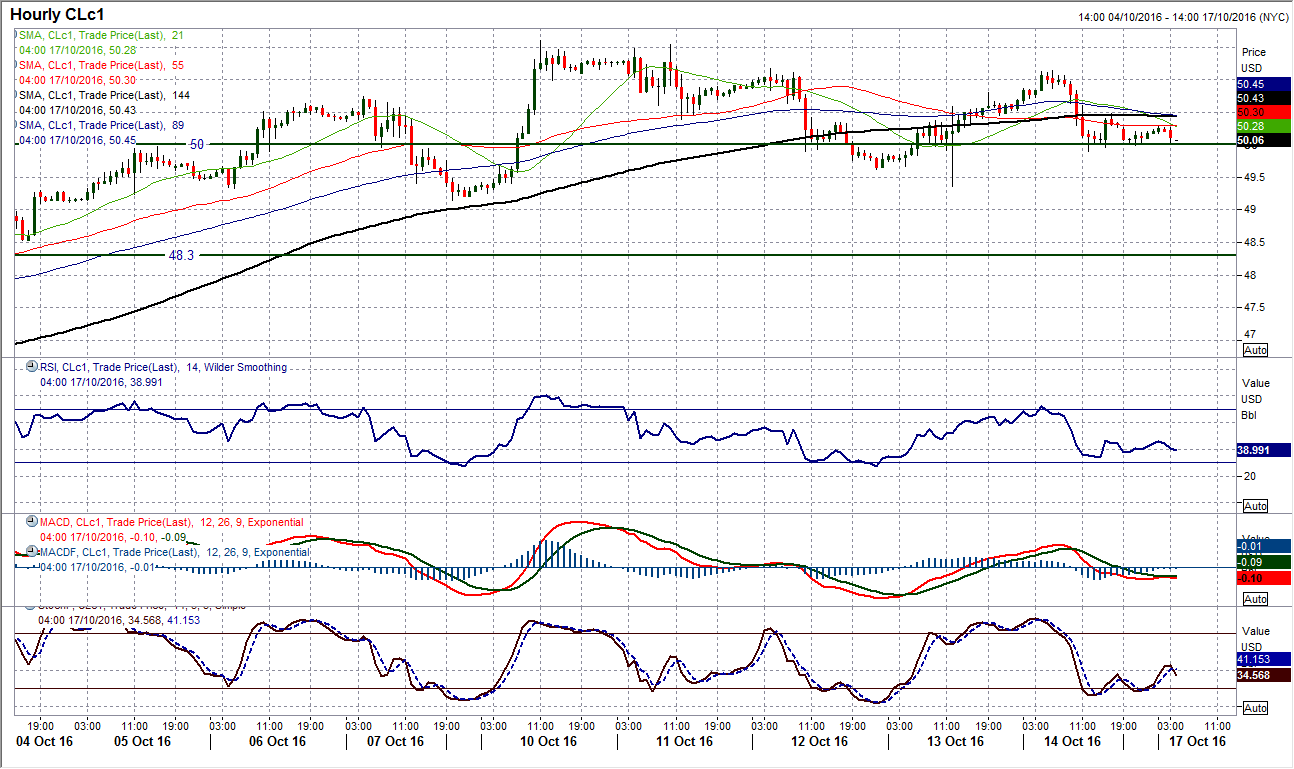
WTI Oil
The market appears to have entered into an increasingly neutral position as a mixed batch of daily candles sustain the key resistance overhead at $51.67. There have now been three negative candles in the past four sessions, but the market seems to be building a consolidation above $49.15. Despite this, the momentum indicators remain in a positive configuration with the RSI around 60 and Stochastics above 80. However, the bulls could not sustain a move higher on Friday and the hourly chart is increasingly neutral as the momentum indicators take on range play characteristics and the moving averages flatten. There is a minor basis of support around $50 that is looking to protect $49.35 and $49.15. Friday’s resistance is at $51.15.
Author

Richard Perry
Independent Analyst
Richard Perry, Independent Market Analyst, has over 20 years of experience working in financial markets in London.


