US CPI and Fed previews: Delays, but dovish
Key points
-
The US CPI and FOMC policy decisions are key events on the market radar this week.
-
Market focus is on disinflation progress; April's softer-than-expected inflation raised hopes for rate cuts, but the May CPI print will be crucial in confirming this trend.
-
The Federal Reserve is expected to keep interest rates unchanged at 5.25-5.50%, with the dot plot and Chair Powell's comments providing insights into future monetary policy.
-
Median dot for Fed Funds rate is likely to sift hawkish to reflect two or less rate cuts this year, but market is front-running that so significant hawkish reaction is unlikely. Chair Powell will also likely balance the narrative in his press conference.
Two key US releases are on the radar for this week:
-
US CPI due Wednesday, 12 June 2024 at 1230 GMT.
-
FOMC policy decision due Wednesday, 12 June 2024 at 1800 GMT.
US CPI preview: Disinflation tests continue
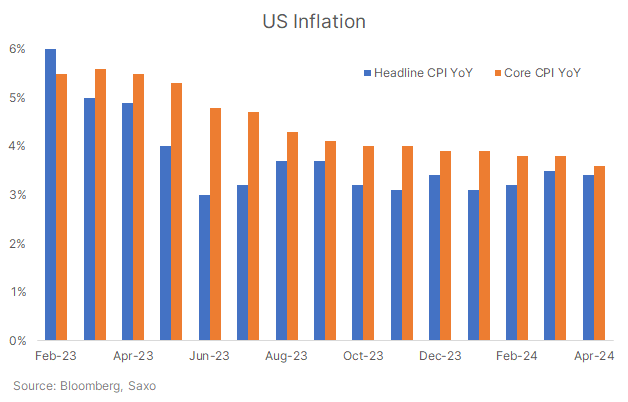
Inflation remains top of mind for market participants, and likely a bigger catalyst for the Fed decision at this point compared to the other mandate of full employment. This is because there were some questions around the disinflation trajectory in the US economy earlier this year when three consecutive prints of inflation came in higher-than-expected. Sticky inflation has meant that the market has pushed back Fed rate cut expectations, and the Fed is only expected to begin its easing cycle in December now.
While April inflation came in softer-than-expected, paving the way for rate cuts once again after the initial pushback, we have argued that one month of data does not constitute a trend. This puts the May inflation print heavily under the radar, to confirm that disinflation is progressing and to give confidence to the Fed to cut rates this year.
Market expectations are as below:
-
Headline CPI: 3.4% YoY (same as April) and 0.1% MoM (vs. 0.3% in April).
-
Core CPI: 3.5% YoY (vs. 3.4% in April) and 0.3% MoM (same as in April, which was a 3-year low).
The key measures to focus on will be:
-
Core CPI MoM – if that rounds off the 0.2%, it can offer relief to markets but if it rounds to 0.4%, there could be further pushback on Fed rate cut pricing for this year
-
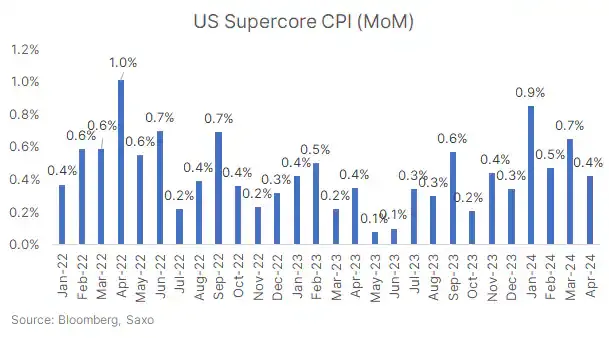
Supercore inflation MoM (core services less housing) – this is also a key focus for markets and it is still running high at 0.42% MoM in April. But markets will likely be relieved if it comes in below 0.4%.
-
Annualized trends – The 3-month and 6-month annualized inflation trends are also closely watched by markets.
Here, we outline the market scenarios for Core CPI print on a MoM basis:
| Core CPI MoM | Market reaction | Investment implications |
| <0.3% | Fed rate cut bets could move to Sept or Nov | Risk-on, potentially positive for equities and negative for USD. 2-year yields could slip below 4.75%. |
| 0.3-0.4% | Fed rate cut expectation for Dec stays | Neutral, and deferred to Fed decision a few hours later. 2-year yields could still move lower. |
| 0.4-0.5% | Overall pricing for Fed rate cuts for 2024 goes down from ~35bps to 25bps | Risk-off, likely pushing equities lower and USD higher. 2-year yields rising towards 5%. |
| 0.5%+ | Fed rate cuts are pushed out from 2024 | Sharp risk off, 2-year yields rise towards 5%, equities could fall ~2%, USD strengthens |
FOMC preview: Median dots to shift hawkish, but Powell will balance the narrative
The US Federal Reserve is expected to keep interest rates unchanged at 5.25-5.50% on Wednesday. Market focus will be on the dot plot and Chair Powell’s press conference to gauge the path of monetary policy in H2 and beyond.
The dot plot outlines the individual members’ views on the path for interest rates, and is an important source of clues to dissect the thinking of the Fed committee members. Market usually focuses on the median dot, and that becomes the de facto monetary policy forecast for the Fed despite a poor history of the dot plot to accurately predict the pace of monetary policy changes.
The last Fed dot plot in March, as shown below, signalled that three rate cuts for the year remained their central view, with three further cuts in 2025. There have been further signs of sticky inflation, as well as a robust labor market since this release, and Chair Powell’s comments at the May meeting also signalled that rates may have to remain ‘high-for-longer’.
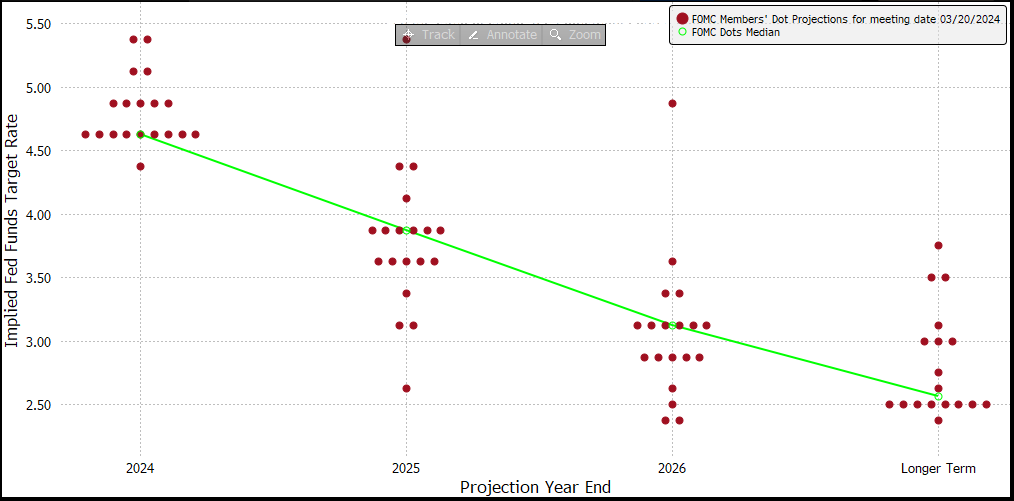
Source: Federal Reserve
This has led to an expectation that the dot plot could shift hawkish at the June meeting this week, which means that it could show two or one rate cut only for 2024 down from three in March.
The US economy has been a mixed bag, and while we started to see some weakness in jobs data (falling JOLTs, rising claims), the recent blowout NFP report last Friday once again questioned whether the economy needs rate cuts urgently. We believe this confusion will be evident in the Fed’s dot plot as well, which could see larger-than-usual dispersion in the forecasts from the different committee members.
Our base case would be that the mean dot reflects two rate cuts for this year. Moving to one rate cut right away could be risky in case the economy weakened sharply over the next few months and then they may be pressed to cut rates more than once this year. However, there is a significant part of the market that is expecting the Fed to show one or no rate cuts at the June dot plot. One such sample is the Bloomberg survey which shows that 43% of the economists polled expect one or no rate cut for the 2024 as median Fed projection. I also did a LinkedIn poll and the results are below.
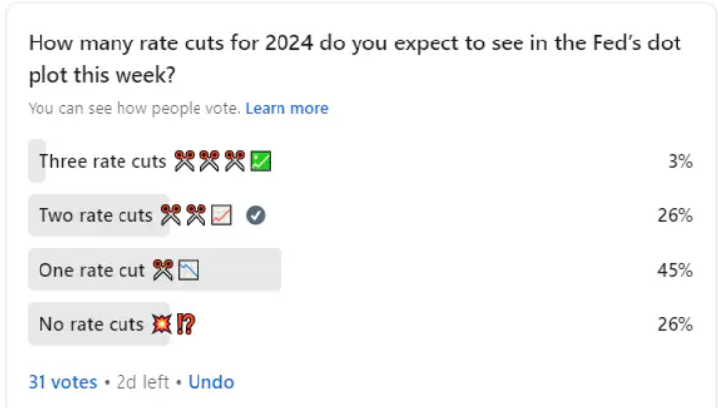
Source: LinkedIn
However, even with two rate cuts as the mean projection, a wide dispersion with a large number of committee members moving their dot to reflect one rate cut would be a relatively hawkish message. Any changes in long-run rate forecasts will also be a key input into Fed’s thinking on the stickiness of inflation and the path of monetary policy in the current cycle. Risk/reward on the Fed meeting is seemingly tilted hawkish, but that means Chair Powell could make an attempt to sound neutral-to-dovish in order to avoid spooking the markets.
Potential investment implications
Despite an expected hawkish shift to the Fed’s dot plot at this week’s meeting, it is important to understand that market is front-running this expectation. This will weaken the hawkish impact from such a decision, at least as long as median dot plot reflects two rate cuts.
| Median Dot | Market reaction | Investment implications |
| Three rate cuts | Fed rate cut bets could move to Sept | Risk-on, potentially positive for equities and negative for USD. 2-year yields could slip below 4.75%. |
| Two rate cuts | Slight increase in Fed curve pricing to about ~45bps from the current 35bps |
Largely neutral, path of least resistance for equities continues to be higher. USD and short-end yields somewhat lower and remain data-dependent. |
| One rate cut | Overall pricing for Fed rate cuts for 2024 goes down from ~35bps to 25bps | Risk-off, likely pushing equities lower and USD higher. 2-year yields rising towards 5% |
| No rate cut | Fed rate cuts are pushed out from 2024 | Sharp risk off, 2-year yields rise towards 5%, equities could fall ~2%, USD strengthens |
Read the original analysis: US CPI and Fed previews: Delays, but dovish
Author
Saxo Research Team
Saxo Bank
Saxo is an award-winning investment firm trusted by 1,200,000+ clients worldwide. Saxo provides the leading online trading platform connecting investors and traders to global financial markets.


