US Consumer Price Index February Preview: Oil disinflation coming?
-
Core inflation expected to be stable in February.
-
Headline inflation predicted to decline on the month.
-
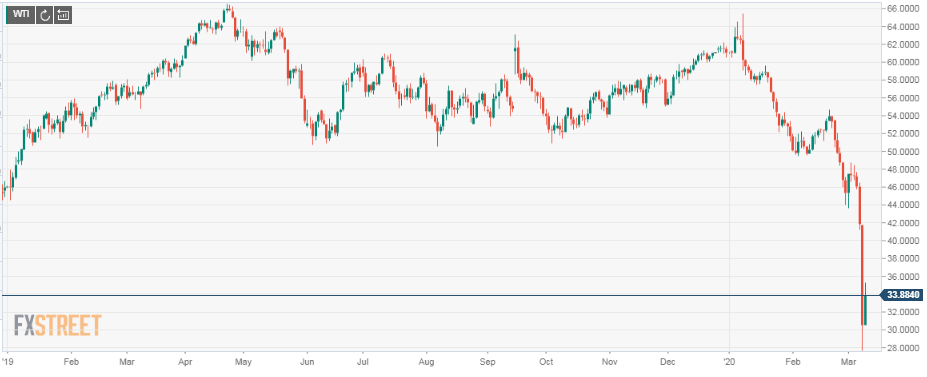
Oil prices fell 15% in the last week of February.

The Bureau of Labor Statistics will issue the consumer price index (CPI) for February on Wednesday March 10 at 12:30 GMT, 8:30 EDT.
Forecast
The consumer price index (CPI) is predicted to be unchanged in February from a 0.1% rise in January. Annual inflation is projected to drop to 2.2% from 2.5% in January. Core inflation is projected to be stable at 0.2% monthly and 2.3% annually in February.
Oil: the basic commodity
The relatively stable US inflation picture whether in the older CPI measure or the Federal Reserve’s preferred personal consumption price index (PCE) gauge may be headed for a disinflationary shock if the 34% drop in West Texas Intermediate (February 21-March 10) becomes permanent.
While the core versions of both inflation indexes are designed to isolate these transitory price shocks from the long-term trend, oil is the basic industrial commodity. It either powers or participates in almost all industrial production. Its effect on a price index can be moderated, it cannot be eliminated.
Russia and Saudi Arabia may disagree on how to meet the challenge of lower global economic growth and oil usage but their dispute did not create the necessity. The closure of parts of China’s economy for upwards of a month in response to the Coronavirus and the spread of it around the world and the likelihood of similar measures in the West is the source.
WTI
US inflation and the Federal Reserve
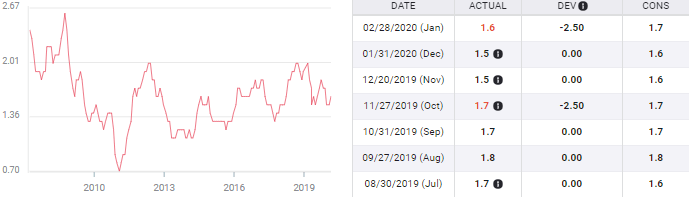
The main US inflation gauges have been relatively steady over the past 13 months. Last year the overall CPI measure varied 0.8% from 1.5% to 2.3% and moved to 2.5% in January. The PCE index has been even narrower shifting from 1.3% to 1.6% and 1.7% in January.
The core versions of each have shown the same limited range: core CPI moving from 2.0% to 2.4% and back to 2.3% in January. Core PCE varied from 1.5% to 1.8% and then 1.6% in January.
All four indexes have exhibited a slight positive trend over the past five years with the CPI keeping its tendency to produce slightly higher readings.
The limited upswing has not produced what the Fed calls a symmetric rate around its 2% target. The considerable rhetoric the bank has expended on predicting the achievement of its inflation goal has not deterred the governors from their immediate intention to maintain and support the US economic expansion and labor market.
Core CPI
Wages and inflation
American unemployment was at a half-century low of 3.5% in February. It has been below 4%, once considered full employment, for 15 months and for 21 of the last 23.
In the economic world before the financial crash this would have been considered a sign that wage inflation pressures were building in the economy. Instead, although annual average hourly earnings have been at or above 3% for 17 months there has been no acceleration. The average has been 3.07% in the six months through February with 3% at the start and end of the period.
The clear meaning is that the 63.4% labor force participation rate represents sufficient labor slack in the economy to restrain wages. In addition payroll growth has slowed about 20% this year. Employers are not offering higher wages because they do not have to.
Conclusion: Fed policy and the dollar
The collapse in crude prices that began in the last week of February and continued in March will be the focus of this CPI report and its implication for the PCE data at the end of the month.
Through the economic developments of the last 12 months, first the US-China trade threat to growth and now the viral impact on the global expansion the Fed’s policy has remained centered on the US economy, not on inflation.
The possibility that inflation is headed lower is high given the decline in crude oil prices. The Fed will no doubt mention this if it drops rates again at next week’s FOMC meeting, but it would be a gloss on what the bank intended to do for economic reasons. For the moment the dollar is largely determined by the Treasury market. When those rates begin to recover so will the greenback.
Author

Joseph Trevisani
FXStreet
Joseph Trevisani began his thirty-year career in the financial markets at Credit Suisse in New York and Singapore where he worked for 12 years as an interbank currency trader and trading desk manager.


