Upcoming Jobs Report: What will the Unemployment Rate be?

Next Jobs Report May 8
Normally jobs reports are the first Friday of every month. However, the next report is due Friday May 8, not Friday May 1.
We have one more week of unemployment claims posted today to crunch a new unemployment rate estimate.
Key Points
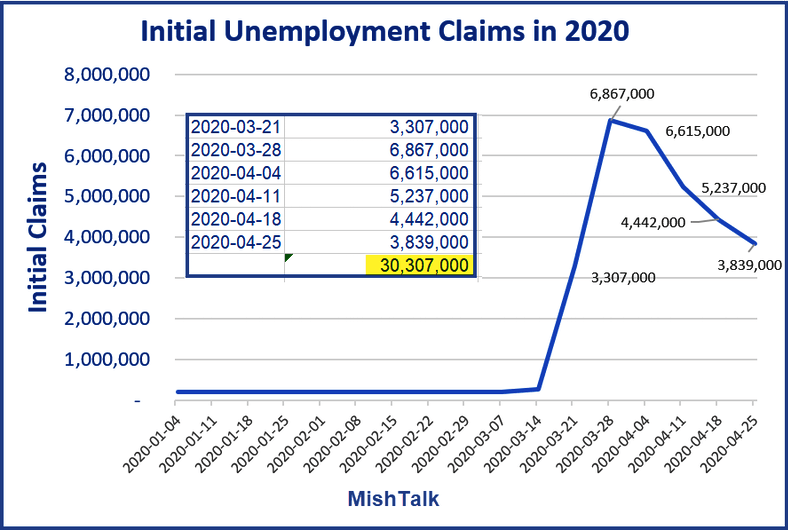
- Today's initial claims estimate from the BLS is 3,839,000.
- That makes the six-week running total a whopping 30.307 million unemployment claims.
Let's crunch the numbers starting with totals from the March Jobs Report and today's report Over 26 Million Unemployment Claims Filed in Just 5 Weeks.
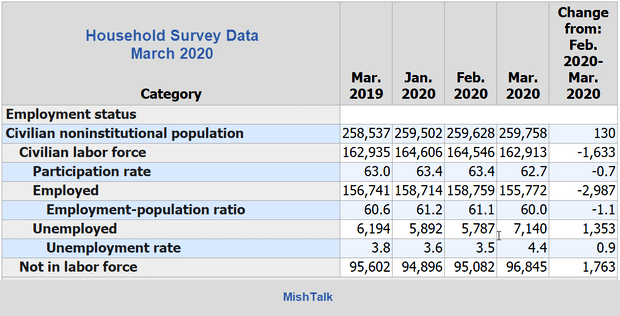
Household Survey Numbers
Unemployment Rate Calculations
The unemployment rate does not come from caims. Rather, it comes from a phone survey in the week that contains the 12th of the month. That makes the current reference period April 12-18.
The March unemployment rate of 4.4% was wildly low (and will later be revised), because the reference week was before the mass layoff started. That will not be the case in April.
Estimate of the Unemployment Rate
If we assume claims approximate Household Survey answers we can estimate the unemployment rate as follows:
(New Claims + Existing Unemployed + Estimate of Claims to Come) / Labor Force
Last week, in Based on 26 Million Claims, What's the Unemployment Rate? I estimated 4 million claims to come.
Today we see I was reasonably close close to the mark with claims at 3,839,000.
The BLS also made a small upward revision of 15,000 for the week ending 4-18.
We have one more week of claims coming but will those be for April or May?
To err on low side, let's drop the "Estimate of Claims to Come" .
30.303 million + 7.140 million / 162.913 = 23.0%
Last week I estimated 23.1% so essentially there was no change.
Six Caveats
- Just because people filed and unemployment claim does not mean they qualify according to BLS Household Survey guidelines.
- The reverse also holds true. People may qualify for unemployment without filing. Gig workers in particular fall into this category.
- Decline in Labor Force. I held it constant, it won't be.
- Household Survey uncertainties: See The BLS FAQ on the Impact of the Coronavirus Pandemic on the Employment Situation for March 2020
- In the Household Survey if you work as little as 1 hour you are not unemployed.
- The Covid-19 Relief Act may impact claims but not the survey.
Overcounts
- Some states allow those with reduced hours to file for benefits.
- Coupled with point six, there is potential for a sizable overcounts.
Undercounts
- A declining labor force, assuming everything else remains the same, would increase the unemployment rate slightly as the divisor would be a smaller number. This is very minor as the divisor is large and the change in the divisor would be relatively small.
- I estimate there will be another 2 million claims for the week ending Saturday, May 2. If those reflect how people would have responded to the BLS survey April-123 to April 18, then we have a possible sizable undercount.
- Eligible Gig workers may not file.
I expect errors are more likely on the overcount side. Heaven help us if I am way wrong.
Assume a "Net" Overcount of 8 Million
30.303 million + 7.140 million - 8.000 million / 162.913 = 18.1%
Assume a "Net" Undercount of 2 Million
30.303 million + 7.140 million + 2.000 million / 162.913 = 24.2%
Unemployment Rate Range
Based on initial claims data, I expect the unemployment rate to be between 18% and 24%
To pick a specific number, I will go with 21% assuming a net overcount of 4.0 million vs the Household Survey (yielding 20.5%) + another 0.5 percentage points representing a change in the Labor Force.
GDP Estimates Way Too Optimistic
Also, please consider GDPNow Initial Estimate is Way Too Optimistic
What's Next for America?
For a 20-point discussion of what to expect, please see Nothing is Working Now: What's Next for America?
No V-Shaped Recovery
Here's the correct viewpoint: The Covid-19 Recession Will Be Deeper Than the Great Financial Crisis.
Simply put, a quick return to business as usual is not in the cards.
Author

Mike “Mish” Shedlock's
Sitka Pacific Capital Management,Llc
Mike “Mish” Shedlock is a registered investment advisor for SitkaPacific Capital Management.


