Understanding the true job shortage and why it's happening

There's far more than meets the eye when it comes to employment levels and the unemployment rate.
Nonfarm Payrolls and Employment, data from BLS, chart by Mish.
Chart notes
- Nonfarm Payrolls: The payroll survey (sometimes called the establishment survey) is the headline jobs number. It is based on employer reporting.
- Employment Level: Employment numbers and the unemployment rate are from the BLS household survey. It's is a phone survey conducted by the BLS.
Sometime this year, possibly as soon as the April or May jobs data, nonfarm payrolls and the employment level will exceed the pre-pandemic, February 2020 levels.
However, there is a big structural deficit in jobs and employment because population does not stand still.
We can calculate the structural deficit based on existing trend lines in jobs and employment.
Structural deficit
- Nonfarm Payroll Deficit: 5 to 6 Million Jobs
- Employment Level Deficit: 4 to 5 Million Jobs
Where's the deficit coming from?
To answer that question, we need to understand participation rates and population demographics by age group.
Participation rate
The participation rate is defined as the number of people ages 16 and older who are employed or actively seeking employment, divided by the total non-institutionalized, civilian working-age population.
Non-institutionalized means not in prison, a hospital, nursing home, etc.
Labor force participation rates March all years
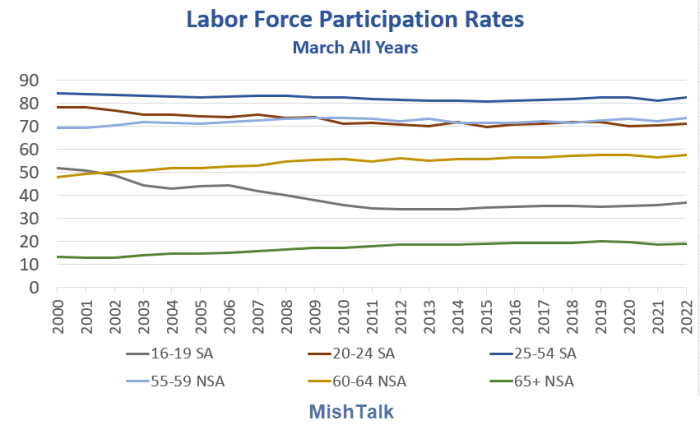
Labor Force Participation Rates data from BLS, chart by Mish
I used Seasonally-Adjusted (SA) numbers where available and not adjusted (NSA) otherwise. Seasonal adjustments are more important for younger groups (think school).
In general, the participation rates have been trending lower except for age groups 60 and older. I expect the participation rate of 65+ has peaked and that will soon head much lower.
To better understand what's happening let's compare pre-pandemic number to March of 2022.
Labor force participation rates pre-pandemic vs March 2022
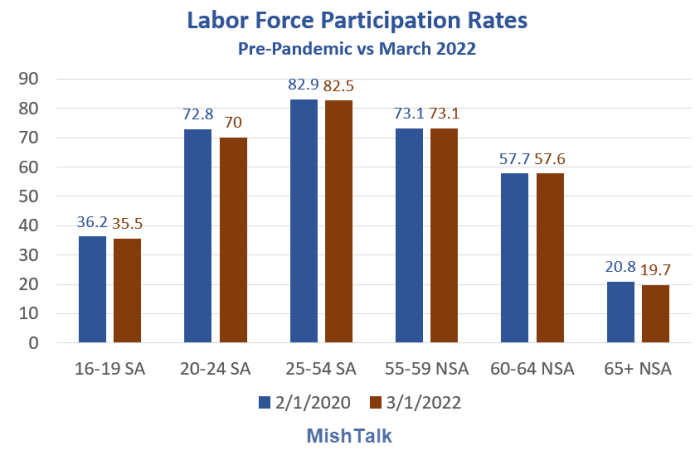
Labor Force Participation Rates data from BLS, chart by Mish
To understand what the declines in rates mean we need to look at population changes.
Population March all years
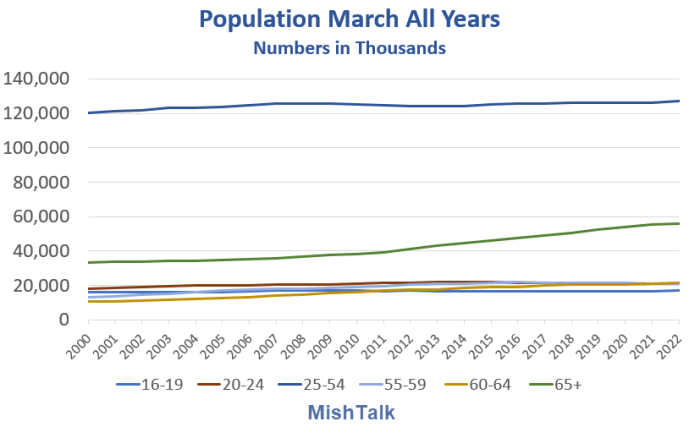
Population data from BLS, chart by Mish
The population of various most age groups is little changed except for age group 65+.
Note the labor force participation rate of age group 65+ is 19.7 percent vs 82.5% for age group 25-54.
Population pre-pandemic vs March 2022
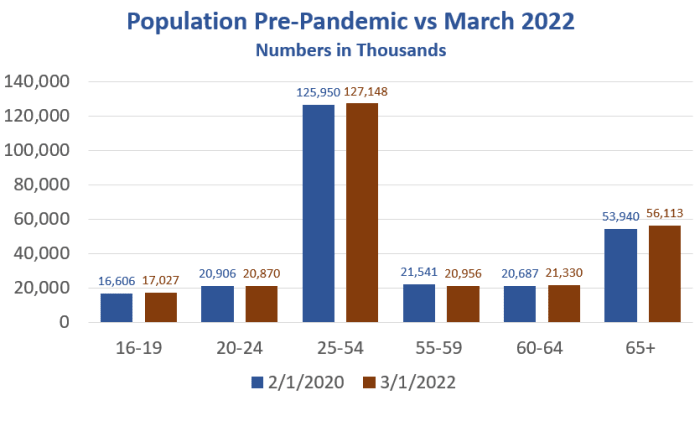
Population data from BLS, chart by Mish
Population change pre-pandemic vs March 2022
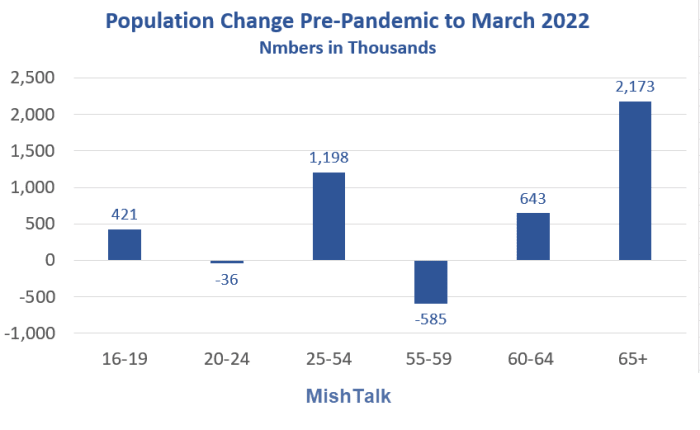
Population data from BLS, calculation and chart by Mish
Key points
- Age group 65+ gained 2.173 million people in the last two years.
- Age Group 60-64 gained 643,000 people
- Age Group 55-59 lost 585,000
- Age Group 25-54 gained 1.198 million people.
Those moving from group 55-59 to 60-64 saw a participation rate change decline from 73.1 pre-pandemic to 57.6 in March of 2022.
Those who moved from age group 60-64 saw a participation rate change decline from 57.7 pre-pandemic to 19.7 in March of 2022.
At age 65, the rate does not immediately drop to 19.7 but to something higher. However the initial drop is very steep. At some age point he participation rate nears zero.
Age group 25-59
That is the core working age group and the largest group as well.
The seemingly small participation rate drop from 82.9% to 82.5% is significant when multiplied by 127.148 million people.
127.148 million * .004 = 508,592.
Had the participation rate remained the same, another half-million people would be working in age group 25-59.
Unemployment rate
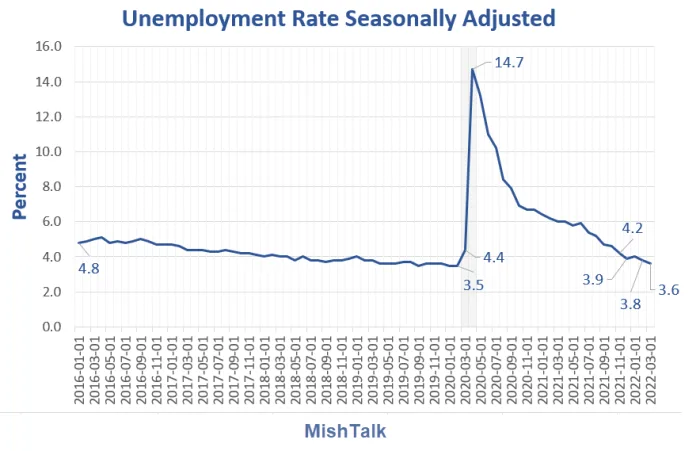
Unemployment rate data from BLS, chart by Mish
Calculation
- Unemployment Level: 5,952,000.
- Labor Force: 164,409,000.
- Unemployment Rate = UL / LF * 100 = 3.6%.
If the overall participation rate remained the same, the labor force and the unemployment level would both be another 4 to 5 million higher. Let's call it 4.5 million.
Adjusted unemployment rate
- Unemployment Level: 10,452,000.
- Labor Force: 168,909,000.
- Unemployment Rate = UL / LF * 100 = 6.2%.
One of my readers noted employment has grown much faster than payrolls. How much of the discrepancy is people selling stuff on eBay, which the BLS will say is employment even if someone makes no money.
If the jobs picture is more accurate than the employment picture, then the shortage is greater.
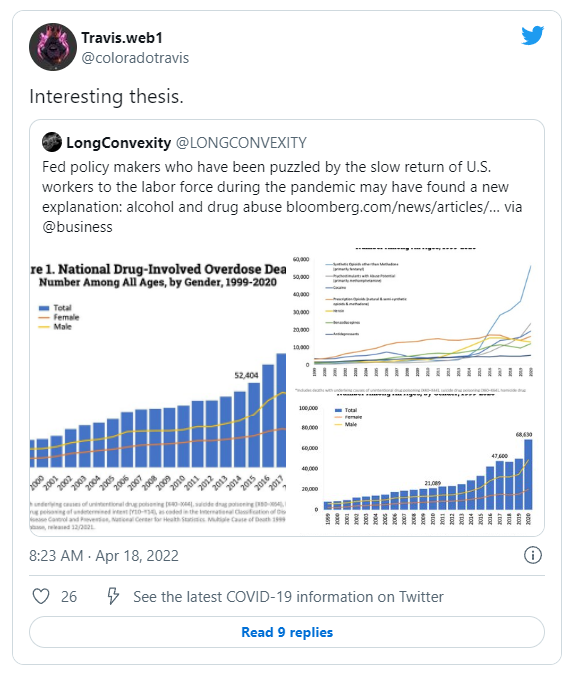
Other factors such as free money, drug abuse, and food stamps influence the desirability and ability to work.
Alcohol and drug abuse
Snap food stamp assistance
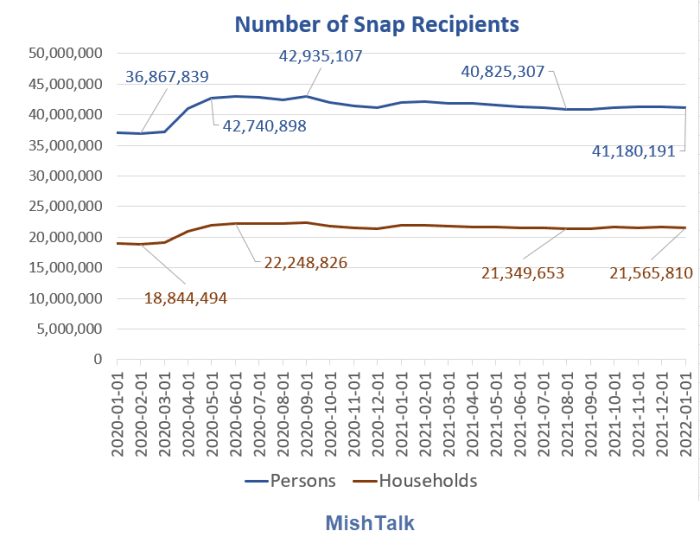
Supplemental Nutrition Assistance Program (SNAP) formerly Food Stamps. Data from USDA, chart by Mish.
SNAP comparison
- Pre-pandemic Recipients: 36.868 million.
- Pre-pandemic Households: 18.844 million.
- January 2022 Recipients: 41.180 million.
- January 2022 Households: 21.566 million.
Pick your number of how this impacts desirability and need to work, but if you make it easy enough to not work, many will choose that route.
Free money
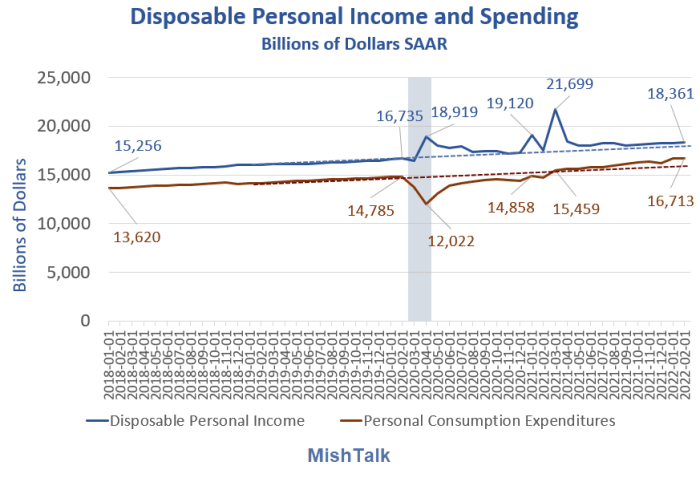
Personal income and expenditures data from BEA, chart by Mish
On April 22, I asked How Much Free Money Stimulus Still Hasn't Been Spent?
I came up with one to two trillion dollars.
What about eviction moratoriums?
Again, pick your number of how this impacts desirability and need to work, but if you make it easy enough to not work, many will choose that route.
Summation
Many workers retired, but many others dropped out of the labor force due to stimulus payments, eviction moratorium's, and stock market wealth impacts.
Others suffered from drug abuse. Still others took advantage of SNAP and free money.
Regardless of reason, the employment level is short 4-5 million workers based on the population increase and current demand for goods and services.
Supply chain disruptions, sanctions, consumer preference changes, drug abuse, and additional demand from a stock market wealth boom all made matters worse.
Expect more stock market pain because it's coming
To curtail demand, the Fed needs to contain demand and one way is to crush the stock market wealth effect.
So Expect More Stock Market Pain Because It's Coming
But rate hikes have unwanted side effects such as also crushing home building while rents are still soaring.
Rent is an inelastic demand and curtailing home building will add to the Fed's problems.
The Fed is very much going to hate the latest bubble that it created.
Author

Mike “Mish” Shedlock's
Sitka Pacific Capital Management,Llc
Mike “Mish” Shedlock is a registered investment advisor for SitkaPacific Capital Management.


