Two Most Important Recession Indicators and Gold

With everyone talking about recession, investors desperately need some clues to assess the state of the economy. This is what our today’s article provide you with. We invite you to read it and find out what are the two most important recession indicators – and what is the link between them and the gold prices.
Two Most Important Recession Indicators and Gold
With everyone talking about recession, investors desperately need some clues to assess the state of the economy. We have already discussed how the NBER determines recessions, pointing out that its indicators are not the best tools for forward-looking precious metals investors. We mean here that the real GDP, real income, industrial production, retail sales and employment are not close to flashing red, but even when they do, the recession will already be underway.
So what other indicators can investors use to predict recession? Well, there is clearly no single indicator that would determine economic slump, but there are several indicators investors closely monitor. Two of them stand out: the unemployment rate and the yield curve.
The unemployment rate is often a leading indicator of the business-cycle peak. We mean here that the unemployment rate tends to reach a trough shortly before an economic recession – and when it begins, the unemployment rate rises sharply.
For example, as the chart below shows, the unemployment rate reached its lowest level prior to the outbreak of the Great Recession in March 2007 and then again in May 2007 at 4.4 percent and climbed to 5.0 percent by December 2007, when the recession officially started.
Chart 1: Unemployment rate from January 1998 to January 2019 (index, when December 2007 = 100).
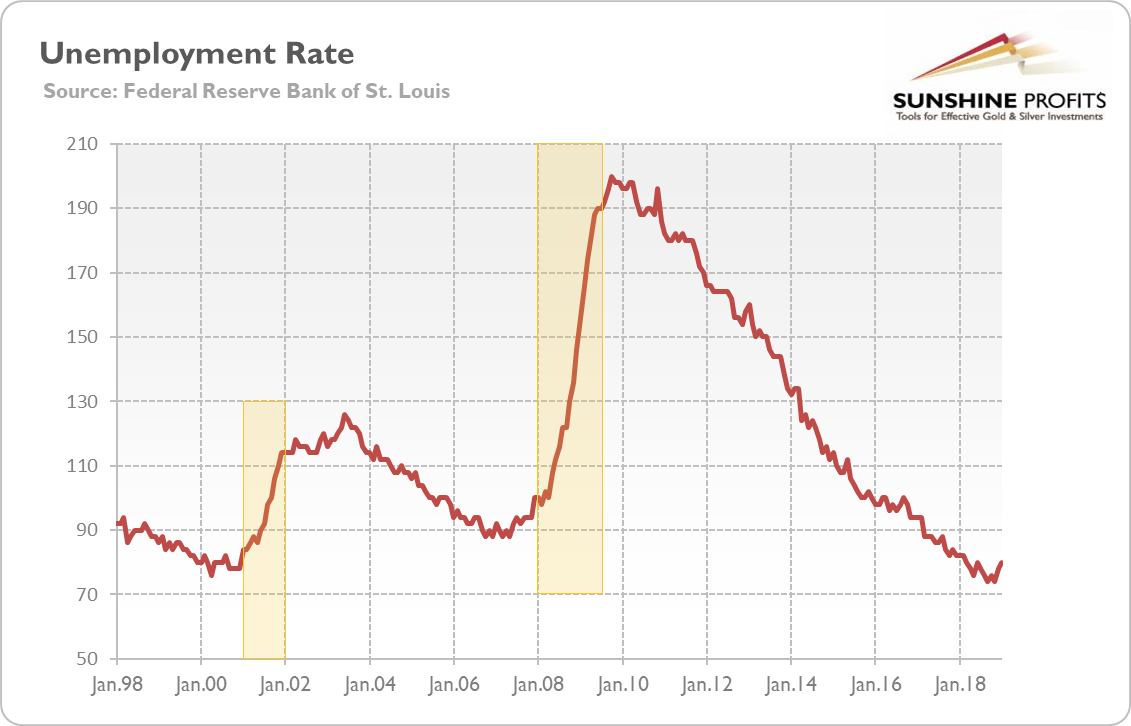
Similarly, it reached a local bottom at 3.8 percent in April 2000 and remained later at 3.9 percent from September to December 2000, rising to 4.3 percent in March 2001, when the recession began. Historically, the unemployment rate trough occurred about nine months before the official start of the recession.
And what is the current situation? Well, the unemployment rate reached the multi-year low of 3.7 percent in September 2018 and then again in November 2018, increasing since then. It might be disturbing, but we have to remember that the labor force participation has been also rising, which is a sign of economic strength not weakness.
Moreover, the government shutdown probably contributed to the uptick in the unemployment rate as 175,000 more people were recorded in January on temporary layoff. Without the government shutdown, the unemployment rate would therefore probably remain at 3.9 percent. Hence, it’s too early to ring an alarm based on that metrics. Gold bulls may be disappointed, but this what data tells us.
The second most popular recession indicator is the inversion of the yield curve. It is similarly reliable, but it has one significant advantage over the unemployment rate: while we never can be sure that a trough in the latter has occurred, we do not have to wonder whether an inversion in the yield curve has happened.
We have discussed this indicator in recent editions of the Market Overview (in August and again in September 2018), but let’s reiterate our stance on the inversion of the yield curve as a signal of the upcoming recession. Technically speaking, inversion occurs when the yield on short-term Treasury bonds exceeds the yield on long-term Treasury securities. Normally, long-term interest rates should be higher than the short-term ones, but when the Fed raises its short-term policy rate to tighten its monetary policy, inversion may occur.
Or, to put it differently, the increase in money supply has two effects on interest rates. There is a Wicksell effect, which lowers the short-term interest rates, as the new money enters the modern economy through the credit market, increasing the credit supply. But there is also a Fisher effect, which raises the long-term interest rates, as the increase in money supply raises the inflation expectations. As the latter effect operates with certain lag, the yield curve steepens when the Fed conducts easy monetary policy. It triggers the boom and the malinvestments occur. However, the monetary injection drives prices higher and the central bank tightens the monetary policy. When there is a credit crunch, entrepreneurs must scramble for funds and the short-term interest rates rise, which inverts the yield curve.
So much for the theory. Let’s look now at the chart below. As one can see, both the spreads (between 10-year and 2-year Treasuries and between 10-year and 3-month Treasuries) turned negative a couple of quarters before the last two recessions.
Chart 2: Spread between 10-Year Treasury Constant Maturity and 2-Year Treasury Constant Maturity (red line, left axis, in %) and spread between 10-Year Treasury Constant Maturity and 3-Month Treasury Constant Maturity (red line, left axis, in %) from January 1998 to February 2019.
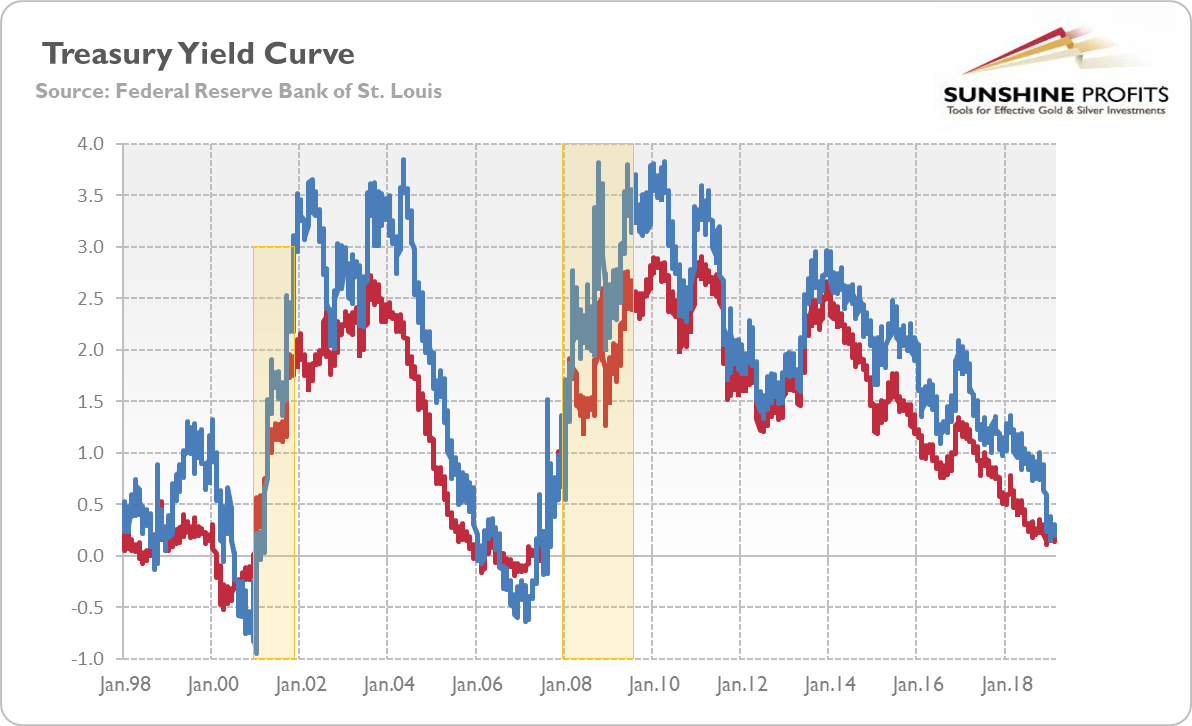
Actually, an inverted yield curve has regularly occurred prior to recessions since the mid-1950s. However, as we explained earlier both in the Market Overview and the Gold News Monitor, the yield curve is now artificially flat because of the global quantitative easing programs, which reduced the long-term interest rates. You see, prior to the Great Recession, the central bank mainly intervened at the short end of the yield curve, but that changed with the implementation of the unconventional monetary policy. The central banks’ asset purchases reduced term premium, so the yield curve become flatter.
Moreover, the U.S. Treasury Department has been recently borrowing more money to finance increased budget deficits and it has mainly done so with short-term debt, it pushed the short-term yields up, additionally flattening the curve. So when the fiscal stimulus wanes (and with the end of the ECB’s quantitative easing), the yield curve may actually steepen.
Therefore, the yield curve lost some of its predictive power. Or, it reflects now financial rather than economic developments. And it still remains positive, so even if somebody does not agree with our assessment of the yield curve’s predictive power in the current economic environment, the recession in 2019 is unlikely. After all, recession predictions based on the yield curve require an inversion – and it has not happened yet.
What does it all mean for the gold market? Well, first, the analyzed indicators – the unemployment rate and the yield curve – do not indicate that the US recession is coming. Second, the yield curve is more intuitive to use as its inversion is easier to determine in contrast to the trough in the unemployment rate. Third, even when the yield curve inverts, it does not, however, necessarily imply that the recession is inevitable due to some financial or structural changes. The wise precious metals analysts should examine many indicators and the broad macroeconomic context rather than betting on one or two data series. Fourth, gold bulls who count on the recessionary rally in the gold market may be disappointed. The risk of recession has increased, but they have to wait more for its arrival.
If you enjoyed the above analysis and would you like to know more about the fundamental outlook for the precious metals, we invite you to read the MarchMarket Overview report. If you’re interested in the detailed price analysis and price projections with targets, we invite you to sign up for our Gold & Silver Trading Alerts. If you’re not ready to subscribe yet and are not on our gold mailing list yet, we urge you to sign up. It’s free and if you don’t like it, you can easily unsubscribe. Sign up today!
Want free follow-ups to the above article and details not available to 99%+ investors? Sign up to our free newsletter today!
Author

Arkadiusz Sieroń
Gold Price Forecast
Arkadiusz Sieroń received his Ph.D. in economics in 2016 (his doctoral thesis was about Cantillon effects), and has been an assistant professor at the Institute of Economic Sciences at the University of Wrocław since 2017.


