Trump’s ban on Muslims turns sentiment negative

Market Overview
Donald Trump continues to dominate headlines and there is an increasingly protectionist theme to his early moves in which he seems vehemently prepared to implement some of event the more controversial pledges during the election campaign. Trump’s decision for a ban on Muslims from seven Islamic countries for at least 90 days is the latest move that is drawing condemnation and markets are acting cautiously now. Risk sentiment is turning more negative today as Treasury yields turn lower and other safe haven assets such as the yen and gold are also finding support. Equities are coming off their recent highs and markets have begun the week under pressure. This is an extremely important week for economic data with a vast array of tier one data that will drive markets. However we begin with Donald Trump once more the driving factor.

Although Wall Street was around the flat line on Friday with the S&P 500 -0.1% at 2295, Asian markets have been broadly lower overnight with the Nikkei-0.5%. European markets are also opening around half a percent lower today. Forex markets show the dollar is under pressure and trading broadly weaker, but it is also interesting to see the higher risk commodity currencies (Aussie and Kiwi) also performing weaker. Gold and silver are supported, whilst the oil price is around half a percent weaker with the reduced risk appetite.
There is a range of data points throughout the early European session with the Eurozone sentiment indicators but also the German CPI inflation data which for the whole country is released at 1300GMT and is expected to continue to rise to 2.0% year on year (from +1.7% last month). The FOMC’s preferred measure of inflation, the Personal Consumption Expenditure is at 1330GMT which is expected to be +0.2% for core PCE month on month. US Pending Home Sales are at 1500GMT and are expected to grow by +1.1%.
Chart of the Day – AUD/USD
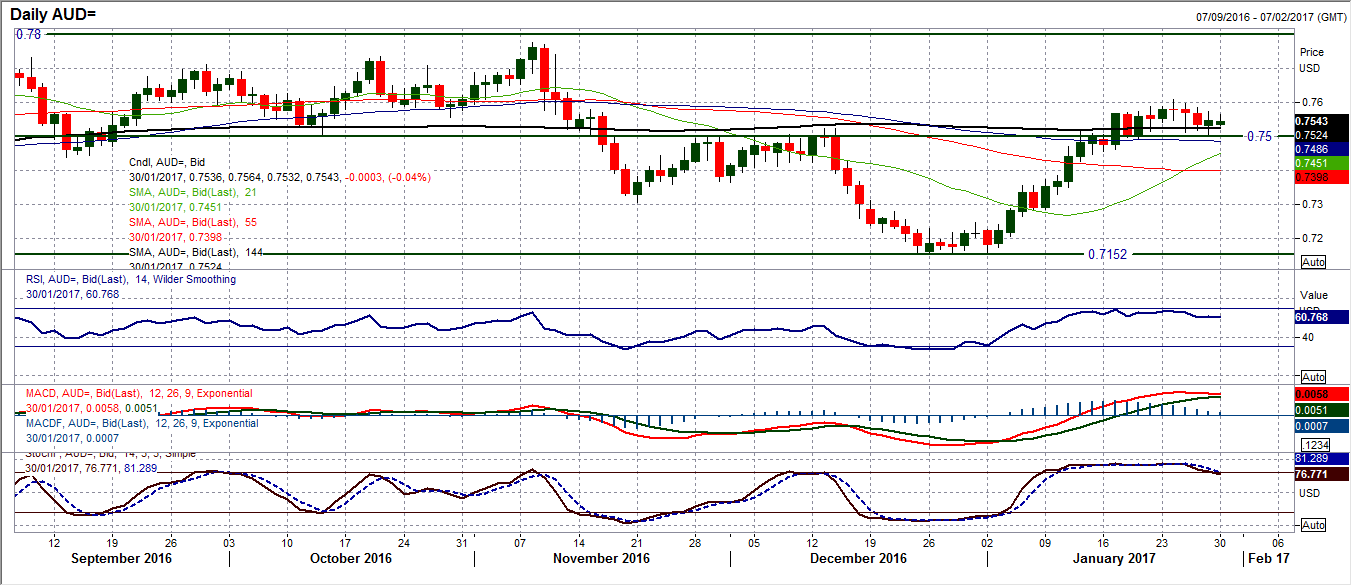
The Aussie has rallied against the US dollar since the end of December but there are a few signs now that the market is looking tired and could be preparing for a corrective move again. Having consistently been running higher, the past few sessions have been posting less positive candles in addition to a run of lower highs and lower lows. Last week was dominated by corrective candles despite Friday’s minor gains. The momentum indicators are now threatening to roll over, with the MACD lines plateauing and the Stochastics crossing lower. This is though still a touch early in calling an end to the bull run and could still turn out to be simply a consolidation phase. Watch for the daily RSI dropping below 50,a bear cross on the MACD lines and a confirmed crossover sell signal on the Stochastics. This now means that the support at $0.7490 will also be watched. The hourly chart reflects a slightly negative bias within a consolidation but without any real selling intent quite yet. Below $0.7500 is a move back below a medium to longer term pivot, whilst a break below $0.7490 would also complete a nearer term small 120 pip top pattern. Resistance near term is $1.7585 and $0.7610.
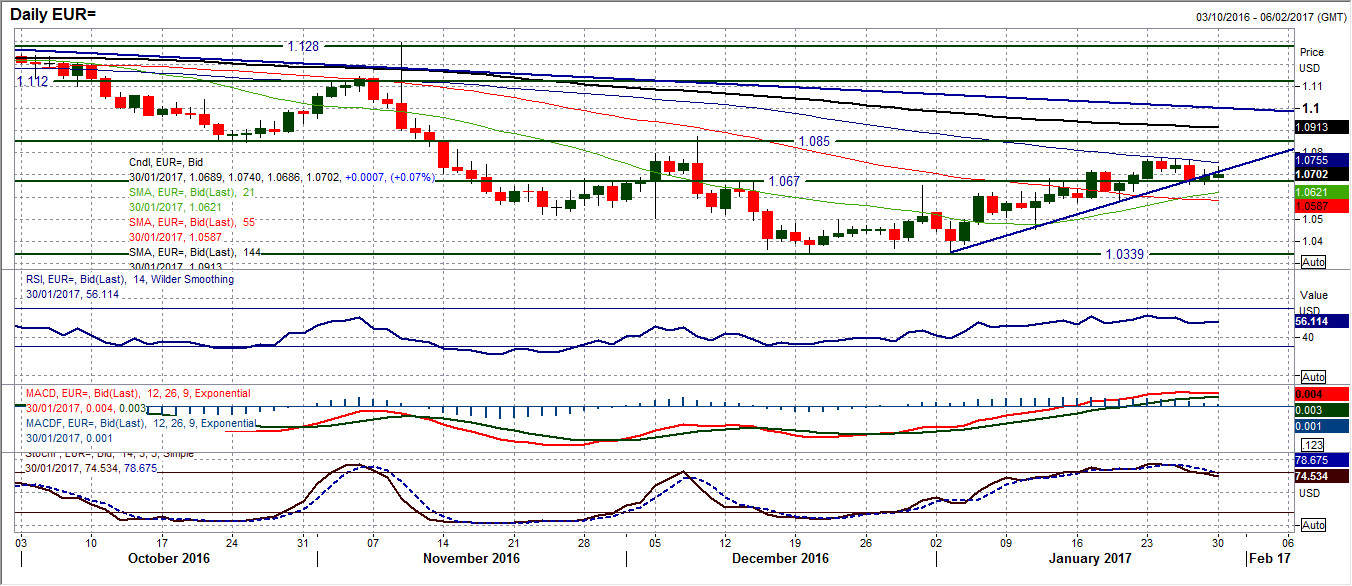
The bull trend that has formed over the past few weeks was breached on an intraday basis on Friday but not to the extent that the bulls are ready to entirely give up control. The market is still trading around the uptrend without fully confirming the break. The momentum indicators have rolled over and lost their upside impetus, but again this could simply prove to be part of a consolidation phase. Throughout the past couple of weeks the market has found support above $1.0577 whilst last week the key pivot at $1.0670 is still being regarded near term. A close below $1.0670 would confirm the bulls having lost control, whilst the bear would be in control below $1.0577. Until then this will be playing out as a near term consolidation under $1.0775. The hourly chart shows a near term pivot has formed around $1.0710 and a drop below that this morning would add downside pressure.
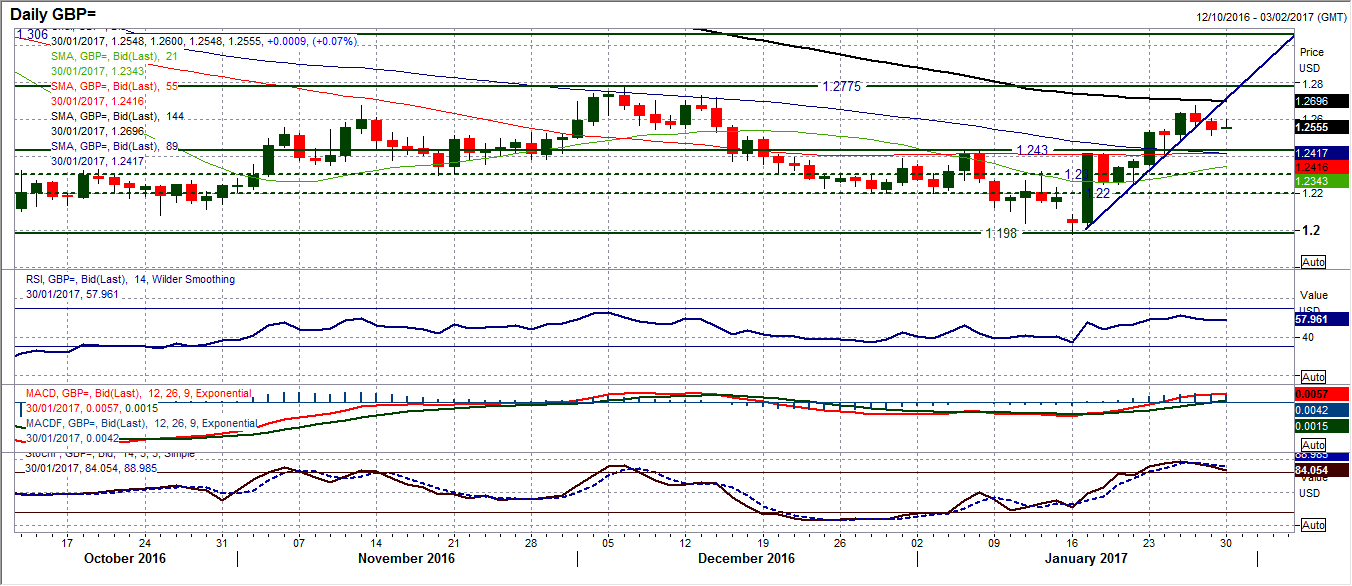
A second consecutive bear candle confirms the run higher which formed the sharp uptrend in the past couple of weeks has been broken. The market now seems to be on corrective slide back which could drag it back towards the key breakout support at $1.2430. This comes as the momentum indicators begin to roll over (especially the Stochastics crossing over in overbought territory) which again suggests the bulls have lost their impetus. This does not yet necessarily mean that the market will start to consistently reverse and could simply play out as a consolidation phase, however the upswing appears to be over for now. The hourly chart shows that the bullishly configured momentum has turned more neutral now and there is a pivot around $1.2550 developing. The resistance of Thursday’s high at $1.2673 is now key, with a lower high at $1.2612. The longer the market consolidates above $1.2430, the more positive the medium term bulls will be feeling for a push back towards the key range high at $1.2775, but for now a consolidation phase is setting in.
USD/JPY
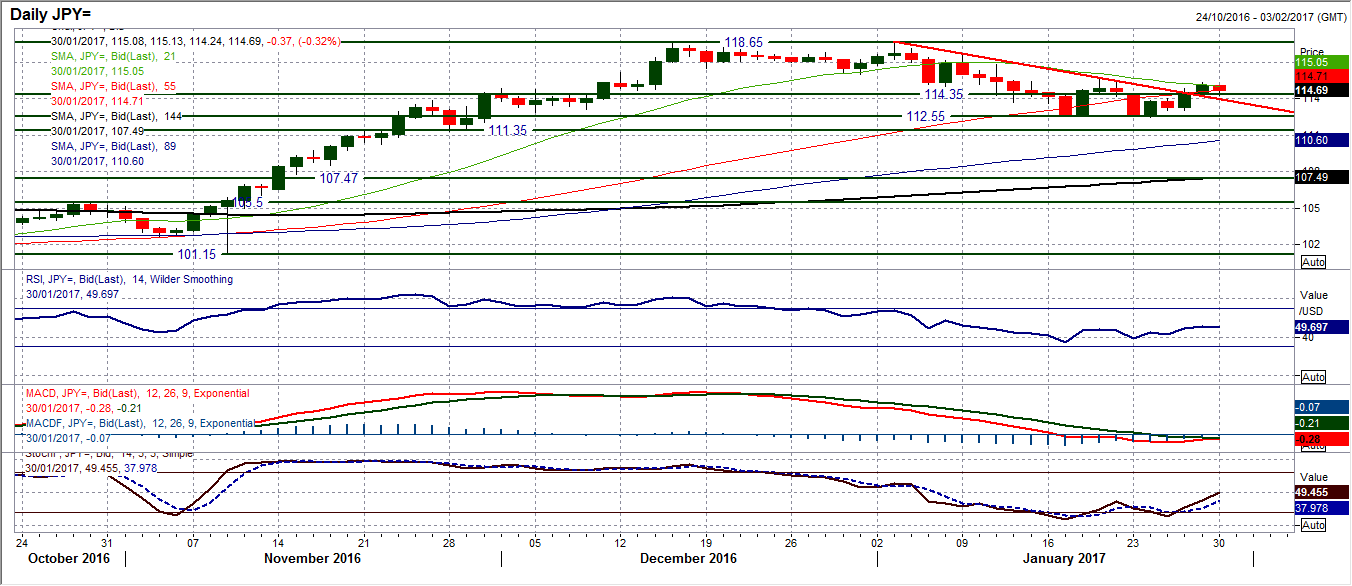
Dollar/Yen has confirmed a bullish break above the three week downtrend following a second consecutive strong positive candle that was posted on Friday. The bulls will now be looking to continue this run now to turn the outlook positive again as they eye a test of the key near term resistance at 115.60. This comes as the daily technical indicators are turning higher again, with the RSI closing Friday back above 50, the Stochastics ticking higher and the MACD lines plateauing. The hourly chart the old pivot around 114.35 is important near term and has already been tested as support this morning. A close back below the support band 114.00/114.35 would be disappointing for the bulls and would suggest that this is in fat merely a consolidation phase rather than the beginning of a potential bull recovery again. This is an important stage for market direction in the near to medium term. Resistance at 115.35 comes from Friday’s high.
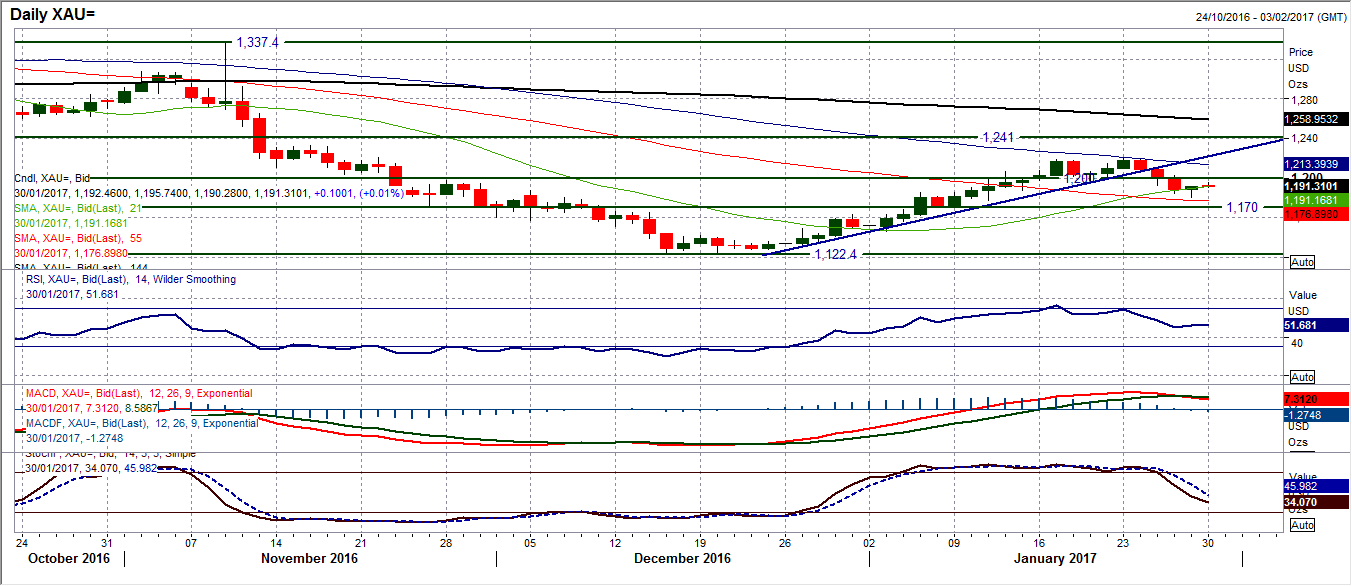
Gold
The outlook had been becoming increasingly corrective in the past few sessions, however a mildly positive candle posted on Friday just adds some doubt near term. A mini hammer candlestick has just given the bulls a bit of a leg up again but can this move be sustained today? The resistance of the $1200 psychological level which has also been an old key breakdown will continue to be a key level to watch, especially on a closing basis. The momentum indicators are increasingly corrective with the MACD lines crossing lower and the Stochastics in decline. The market movement within this $20 band above $1180 which was Friday’s low could be key now for the near to medium term direction which seems to be increasingly in the balance. The hourly chart shows little rebound rolling over at $1195.70 which is also an old support.
WTI Oil
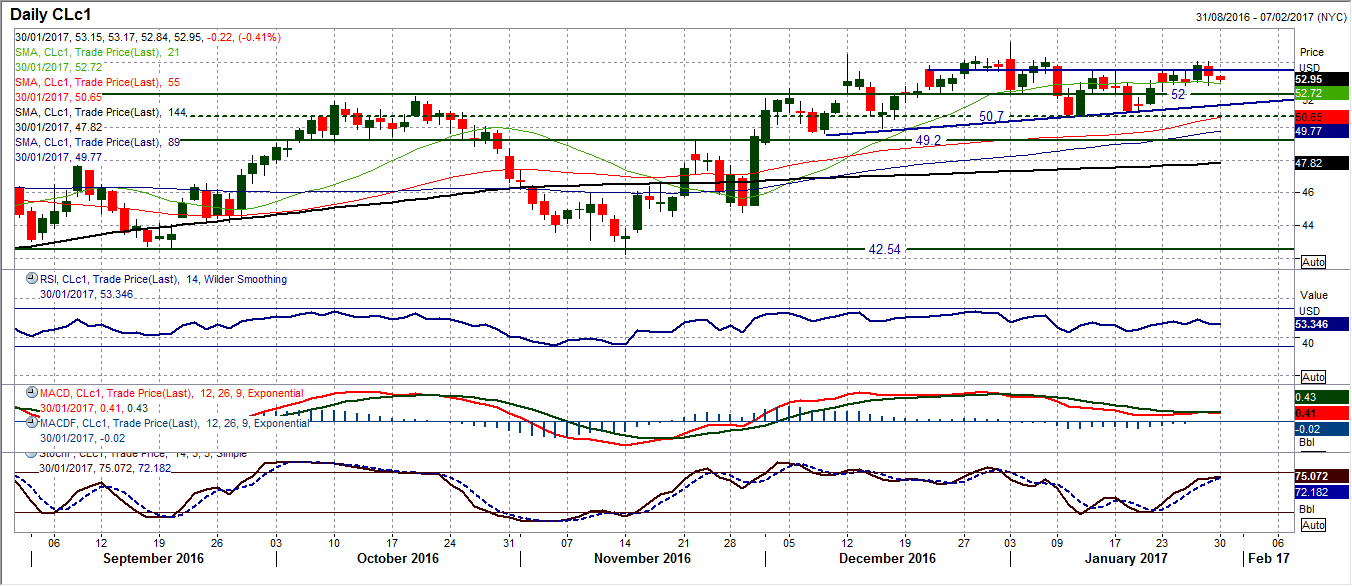
The characteristics of a range play will often be a lack of conviction in moves that seeming look to be breakouts. There can also often be a lot of false moves. This seems to be what we are seeing on WTI oil now. The closing breakout above $53.50, which had taken so many attempts to make the break, looked to be a breakout to back, however Friday’s corrective candle that pulled WTI over 1.5% lower again just shows the uncertainty still in the oil market. This also implies that this is a range play an any extreme moves on momentum signals should be treated as retracement opportunities. The quick failure back below $53.50 shows on the hourly chart momentum indicators as a range play. The market will be looking at support at $52.60 holding today to prevent a deterioration developing, whilst the pivot at $52.00 is the key support near term now. There is a resistance band now between $53.50 and Friday’s high at $54.10.
Author

Richard Perry
Independent Analyst


