As part of President’s Trump campaign pledge, he wants to sharply reduce the tax rate for all businesses from multinational corporations to mom-and-pop shops to 15%. Treasury Secretary Steven T. Mnuchin said this is the biggest tax cut and the largest tax reform in the U.S history. Currently the U.S. corporate tax rate is 35% and it is the highest among developed economies. President Trump also plans to simplify and reduce individual tax rate with the highest individual tax rate dropping to 25%.


The stock market has stalled lately after hitting a record on March 1 due to the worries about soft economic data, the absence of clarity on Trump’s policies, and concern over his failure to push through a healthcare bill. But then last Friday, Trump said he will reveal a “massive” tax package that will deliver cuts “bigger I believe than any tax cut ever.” His statement on Friday was further affirmed by a Saturday tweet

Trump Tax Cut Announcement

Trump

The plan however still faced a long road to enactment and signed into law, as the plan needs to get the approval by Congress and Democrats has expressed doubt about Trump’s plan as fiscally irresponsible. The plan still lacks on details on how to offset the reduced tax revenue, as budget experts believe that the tax cut could cost trillions of dollars in revenue in 10 years, ballooning the government debt. The stock market initial response was favorable and global indices gapped up on the Monday open on April 24. With the much-anticipated tax reform close to reality, investors are emboldened to chase stocks higher and the corporate-friendly tax rate adds upside momentum on the back of upbeat earnings season.
For us at EWF, we know before the news that indices still have more upside due to the bullish Elliott Wave sequence from Feb 2016 low, and we have been telling our members not to sell them and only buy the dips instead. With this latest rally to all-time high, we believe that the stock market rally could be entering the last leg of rally to end the cycle from Feb 2016 low. Let’s take a look at some U.S. stock markets below:

NASDAQ Daily Chart

NASDAQ

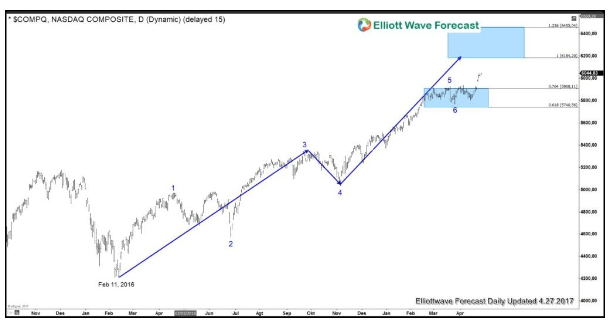
Even before the news, we know that Nasdaq should extend higher as the Elliott wave sequence from Feb 11, 2016 low is showing a 5 swing bullish sequence, which favors more upside. After the news, Nasdaq gapped up then broke to new all-time high but we could see now that the cycle starting from Feb 11, 2016 low should reach extreme area in 7 swing at 6184 – 6455 area. This area could potentially end the cycle from Feb 11, 2016 and when that cycle is over, we could see a pullback in 3, 7, or 11 swing to correct cycle from Feb 11, 2016 low.

Overlay of NASDAQ, RUSSELL, and S&P 500

NASDAQ

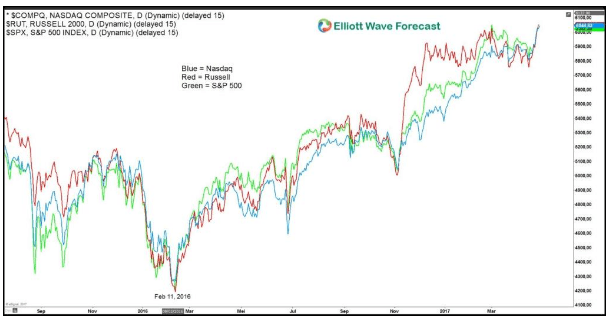
An overlay of the three Indices above shows the same cycle starting from Feb 11, 2016 low, which suggests that the biggest tax cut news could create the last leg rally to end cycle from Feb 11, 2016 before a pull back is seen in the Indices.


FURTHER DISCLOSURES AND DISCLAIMER CONCERNING RISK, RESPONSIBILITY AND LIABILITY Trading in the Foreign Exchange market is a challenging opportunity where above average returns are available for educated and experienced investors who are willing to take above average risk. However, before deciding to participate in Foreign Exchange (FX) trading, you should carefully consider your investment objectives, level of xperience and risk appetite. Do not invest or trade capital you cannot afford to lose. EME PROCESSING AND CONSULTING, LLC, THEIR REPRESENTATIVES, AND ANYONE WORKING FOR OR WITHIN WWW.ELLIOTTWAVE- FORECAST.COM is not responsible for any loss from any form of distributed advice, signal, analysis, or content. Again, we fully DISCLOSE to the Subscriber base that the Service as a whole, the individual Parties, Representatives, or owners shall not be liable to any and all Subscribers for any losses or damages as a result of any action taken by the Subscriber from any trade idea or signal posted on the website(s) distributed through any form of social-media, email, the website, and/or any other electronic, written, verbal, or future form of communication . All analysis, trading signals, trading recommendations, all charts, communicated interpretations of the wave counts, and all content from any media form produced by www.Elliottwave-forecast.com and/or the Representatives are solely the opinions and best efforts of the respective author(s). In general Forex instruments are highly leveraged, and traders can lose some or all of their initial margin funds. All content provided by www.Elliottwave-forecast.com is expressed in good faith and is intended to help Subscribers succeed in the marketplace, but it is never guaranteed. There is no “holy grail” to trading or forecasting the market and we are wrong sometimes like everyone else. Please understand and accept the risk involved when making any trading and/or investment decision. UNDERSTAND that all the content we provide is protected through copyright of EME PROCESSING AND CONSULTING, LLC. It is illegal to disseminate in any form of communication any part or all of our proprietary information without specific authorization. UNDERSTAND that you also agree to not allow persons that are not PAID SUBSCRIBERS to view any of the content not released publicly. IF YOU ARE FOUND TO BE IN VIOLATION OF THESE RESTRICTIONS you or your firm (as the Subscriber) will be charged fully with no discount for one year subscription to our Premium Plus Plan at $1,799.88 for EACH person or firm who received any of our content illegally through the respected intermediary’s (Subscriber in violation of terms) channel(s) of communication.

Recommended Content


Recommended Content

Editors’ Picks

EUR/USD trades with negative bias, holds above 1.0700 as traders await US PCE Price Index

EUR/USD trades with negative bias, holds above 1.0700 as traders await US PCE Price Index

EUR/USD edges lower during the Asian session on Friday and moves away from a two-week high, around the 1.0740 area touched the previous day. Spot prices trade around the 1.0725-1.0720 region and remain at the mercy of the US Dollar price dynamics ahead of the crucial US data.

EUR/USD News

USD/JPY jumps above 156.00 on BoJ's steady policy

USD/JPY jumps above 156.00 on BoJ's steady policy

USD/JPY has come under intense buying pressure, surging past 156.00 after the Bank of Japan kept the key rate unchanged but tweaked its policy statement. The BoJ maintained its fiscal year 2024 and 2025 core inflation forecasts, disappointing the Japanese Yen buyers. 

USD/JPY News

Gold price flatlines as traders look to US PCE Price Index for some meaningful impetus

Gold price flatlines as traders look to US PCE Price Index for some meaningful impetus

Gold price lacks any firm intraday direction and is influenced by a combination of diverging forces. The weaker US GDP print and a rise in US inflation benefit the metal amid subdued USD demand. Hawkish Fed expectations cap the upside as traders await the release of the US PCE Price Index.

Gold News

Sei Price Prediction: SEI is in the zone of interest after a 10% leap

Sei Price Prediction: SEI is in the zone of interest after a 10% leap

Sei price has been in recovery mode for almost ten days now, following a fall of almost 65% beginning in mid-March. While the SEI bulls continue to show strength, the uptrend could prove premature as massive bearish sentiment hovers above the altcoin’s price.

Read more

US economy: Slower growth with stronger inflation

US economy: Slower growth with stronger inflation

The US Dollar strengthened, and stocks fell after statistical data from the US. The focus was on the preliminary estimate of GDP for the first quarter. Annualised quarterly growth came in at just 1.6%, down from the 2.5% and 3.4% previously forecast.

Read more

Majors

Cryptocurrencies

Signatures