Trend P.I. Results & Update: The next change in trend window is over this weekend

1/21 Recap - The S&P opened with an 12 handle gap down and then bounced 9 handles into a 9:35 AM high. From that high, the S&P declined 60 handles into a 10:22 AM low. From that low, the S&P rallied 74 handles into a 11:23 AM high of the day. From that high, the S&P declined 100 handles into a 3:29 PM low of the day. From that low, the S&P rallied 31 handles into a 3:43 PM high. From that high, the S&P declined 29 handles into the close.
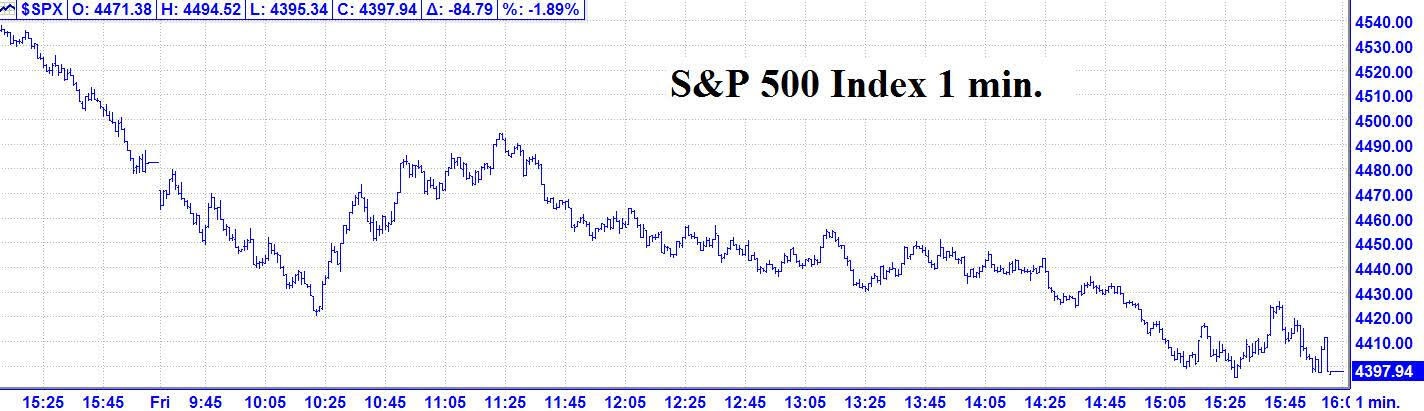
1/21 – The major indices, following a strong rally into mid-day, reversed for another strong down day per the following closes:
INDU – 450.02; S&P 500 - 84.79; and the NASDAQ Composite - 385.10.
Looking ahead - The next change in trend window is over this weekend. The big down day on Friday sets up a potential low
In the first hour or two on Monday. Ideally, we would like to see a big down opening on Monday. Do not chase a big gap up open.
Additionally, the NOW Index is flashing a rare BUY Signal, due to too many shorts. We finally saw some signs of panic on Friday.
The NOW Index has moved to the Buy Zone due to too many shorts. This indicates that a low is likely within one trading day.
Coming Events:
(Stocks potentially respond to all events).
B. 01/21 AC – Venus Perihelion. Major change in trend Cattle, Corn, Copper, Cotton, Gold, OJ, Sugar, and Wheat.
C. 01/25 AC – Jupiter 120 US Jupiter. Important change in trend US Stocks, T-Bonds, US Dollar.
D. 01/25 AC – Saturn 120 US Saturn. Important change in trend US Stocks, T-Bonds, US Dollar.
E. 01/28 AC – Venus in Capricorn goes Direct. Major change in trend Cattle, Coffee, Copper, Cotton, Sugar, & Wheat.
F. 01/28 AC – Jupiter 90 US Ascendant. Important change in trend US Stocks, T-Bonds, US Dollar.
Stock Market Key Dates –
Market Math –
DJIA* – 1/24, 1/25-26, 1/28 AC
S&P 500* - 1/28 AC
Fibonacci – 1/21, 1/25
Astro – 1/24, 1/25-26, 1/28 AC
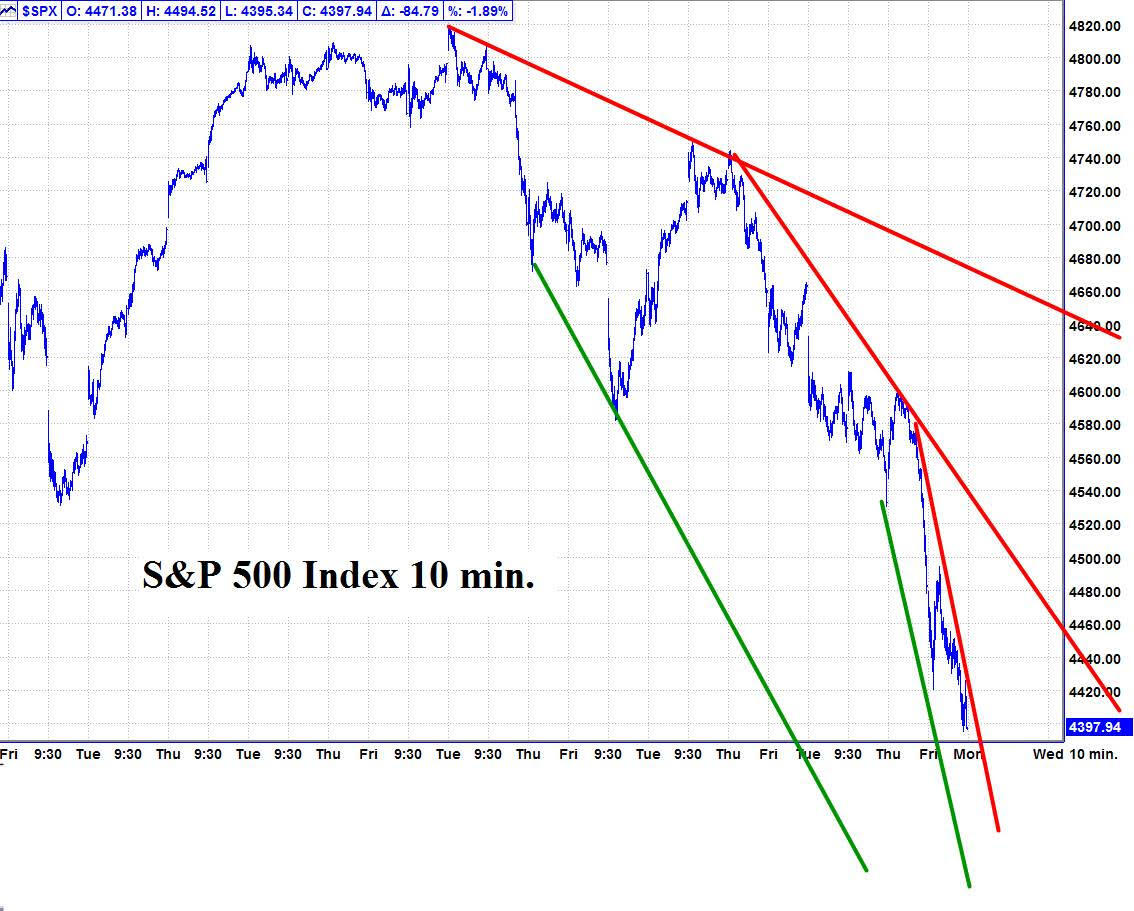
Please see below the S&P 500 10 minute chart.
Support - 4280 Resistance – 4430, 4530
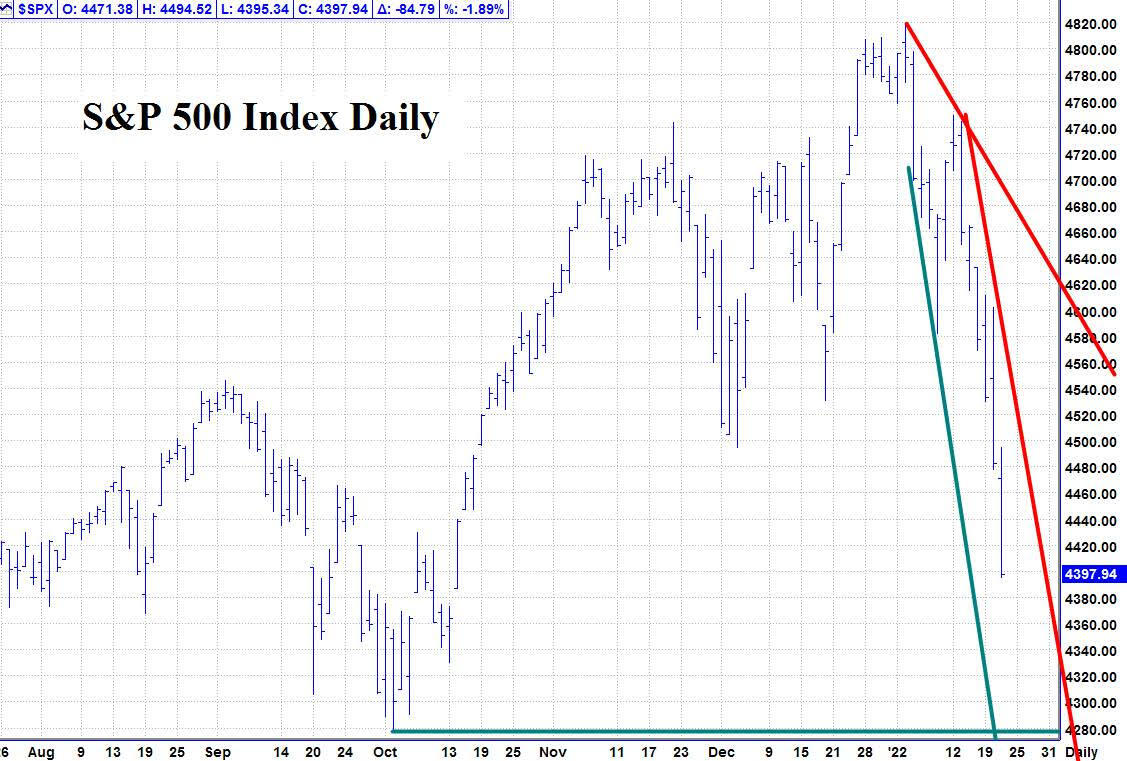
Please see below the S&P 500 Daily chart
Support - 4280 Resistance – 4430, 4530
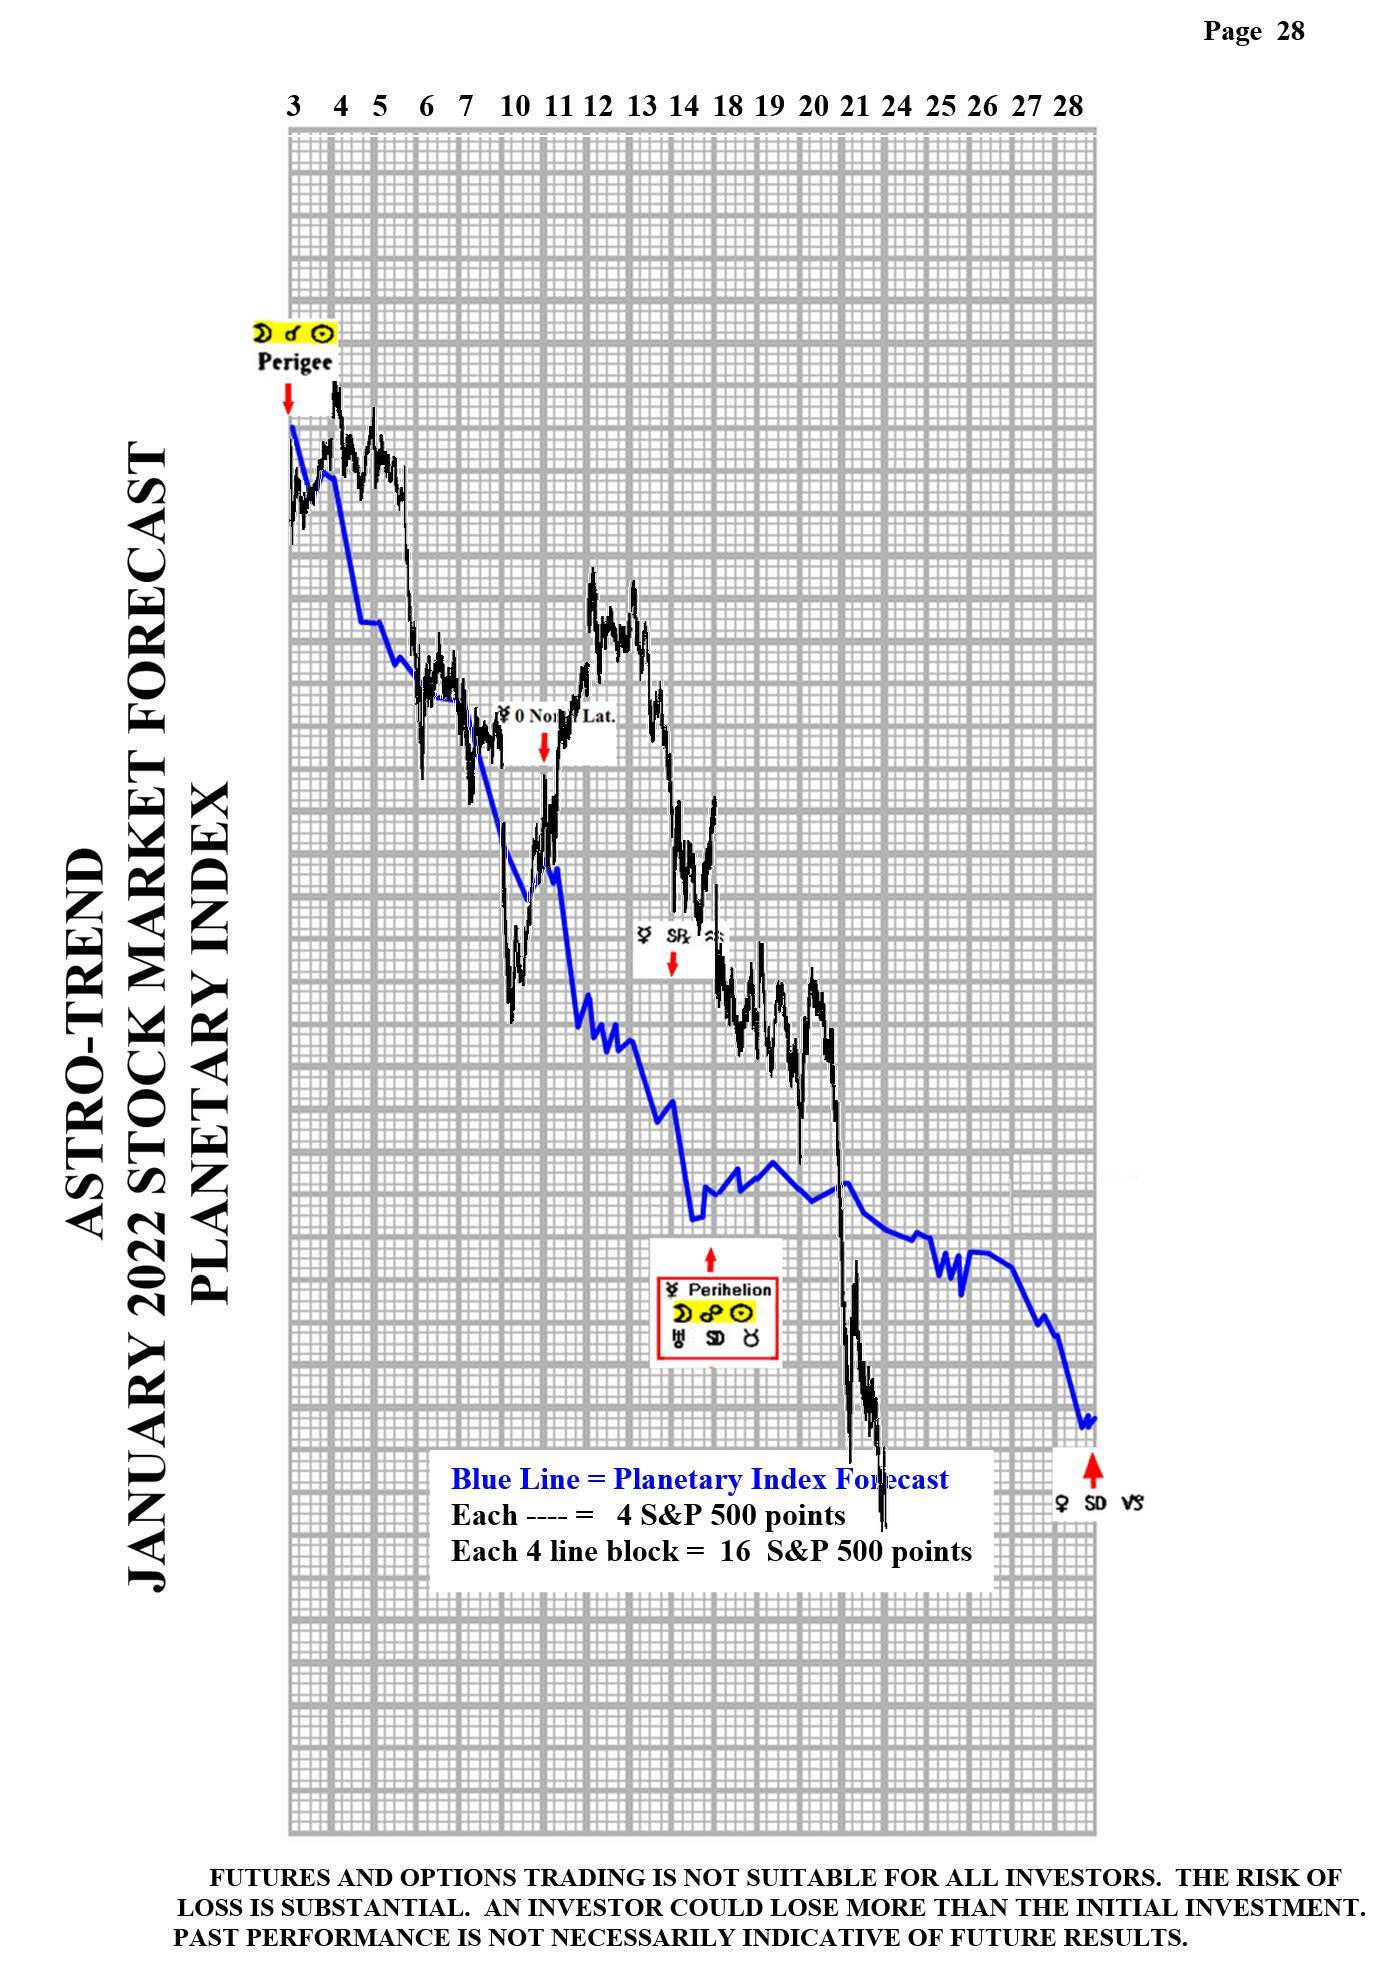
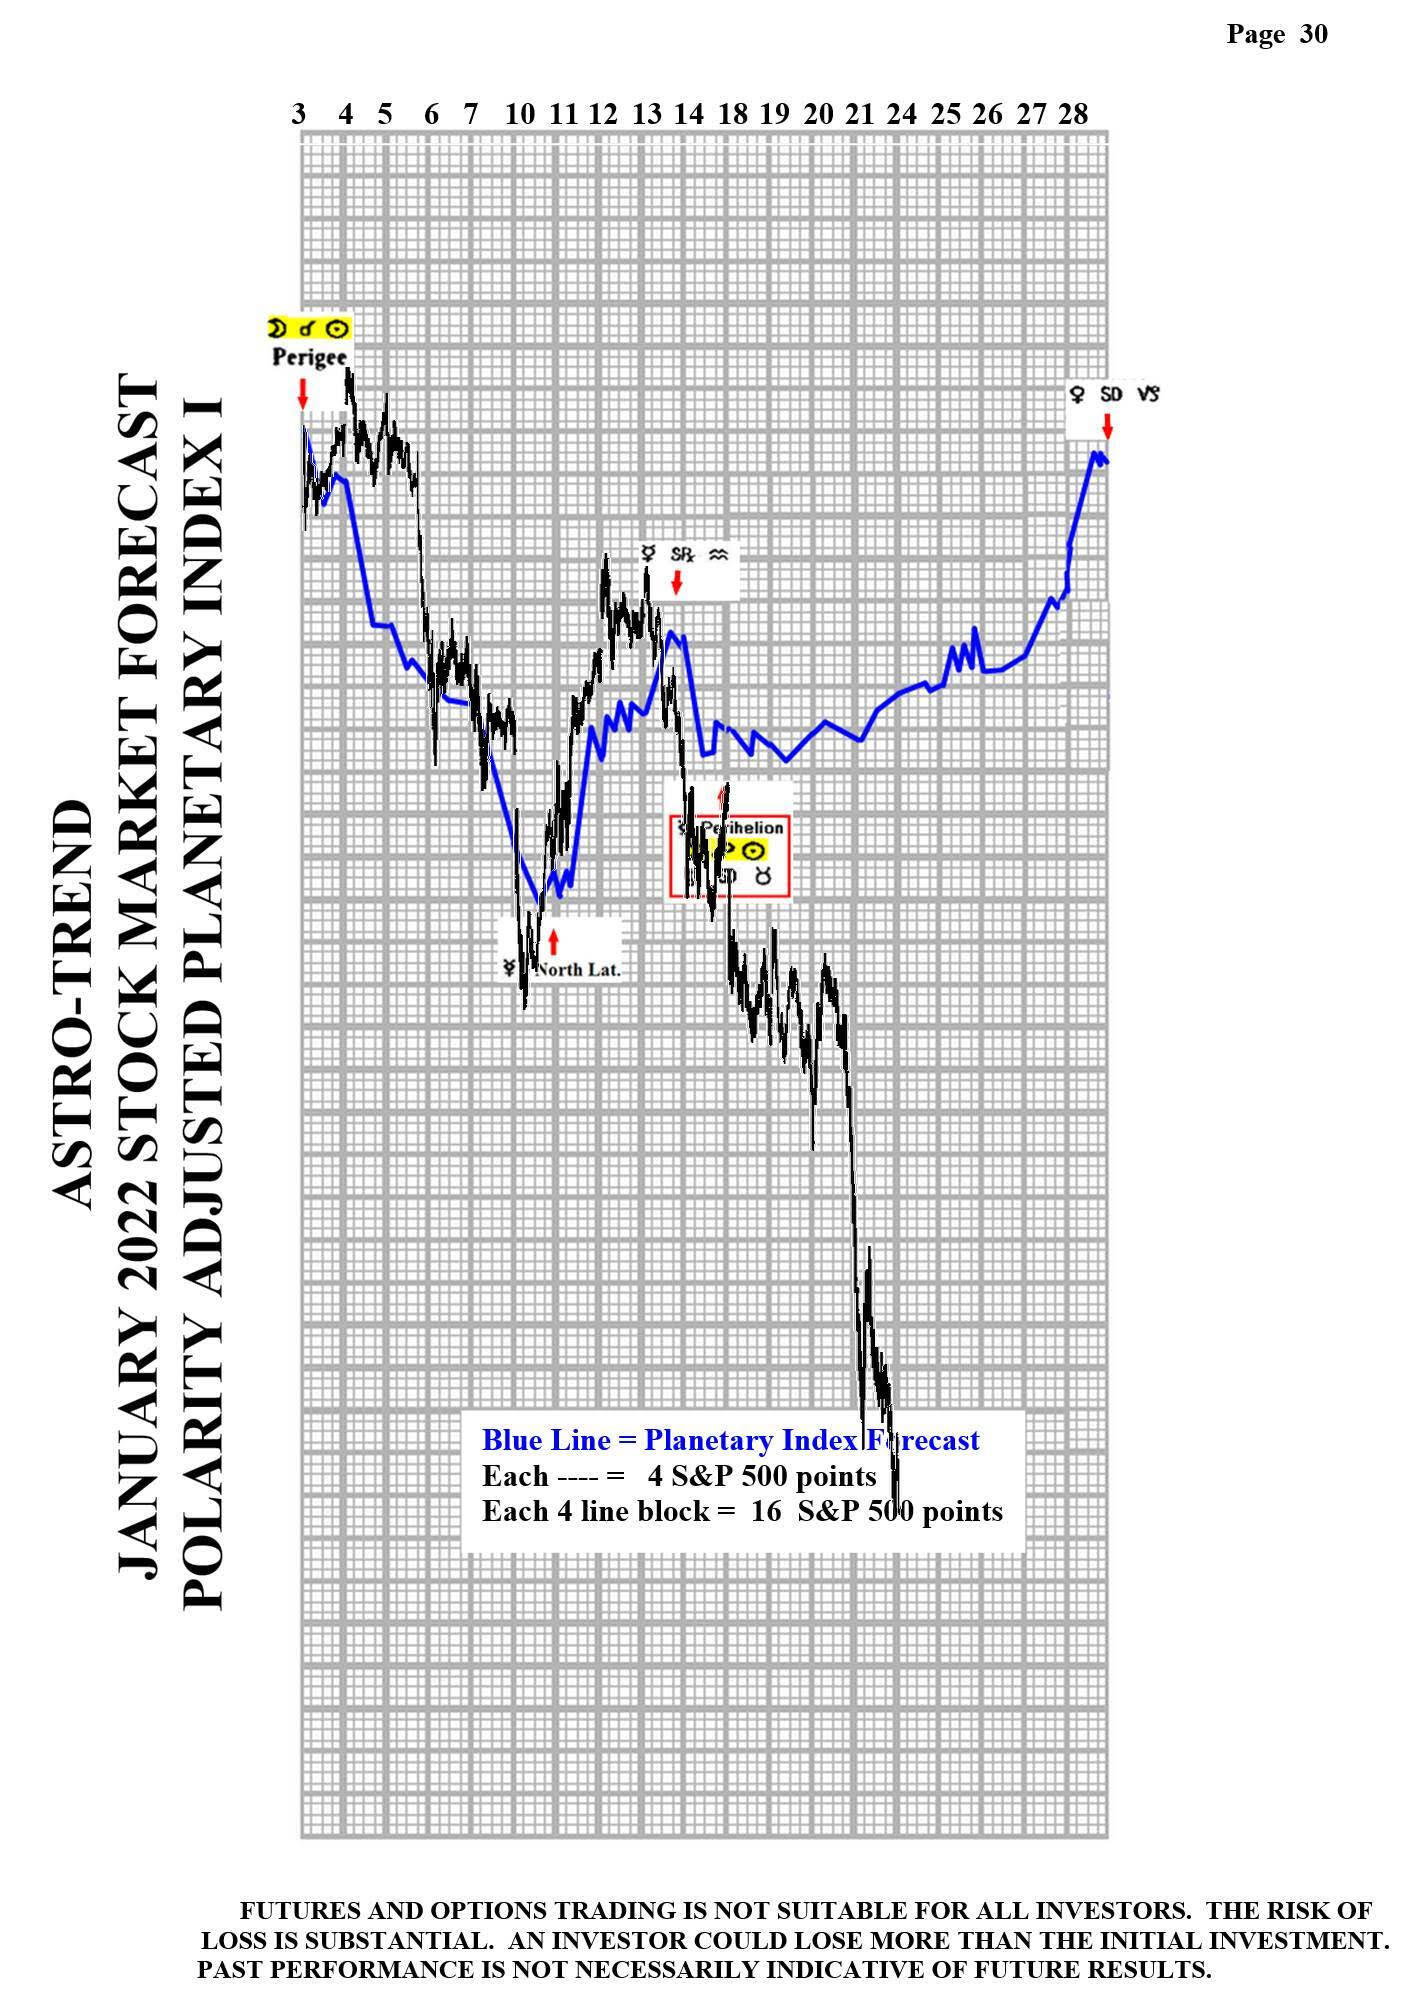
Please see below the January Planetary Index charts with S&P 500 10 minute bars for results.
As of January 21, I am dropping Planetary Index charts marked Pages 29 and 31.
Author

Norm Winski
Independent Analyst
www.astro-trend.com


