Today's daily charts for Gold, Silver and WTI
Gold Daily
-
Gold prices are coiling above October’s high.
-
The trend remains firmly bullish within an ascending channel.
-
A break above 1250.63 confirms a bullish breakout, a counter-trend break of 1241.11 warns of a deeper correction.
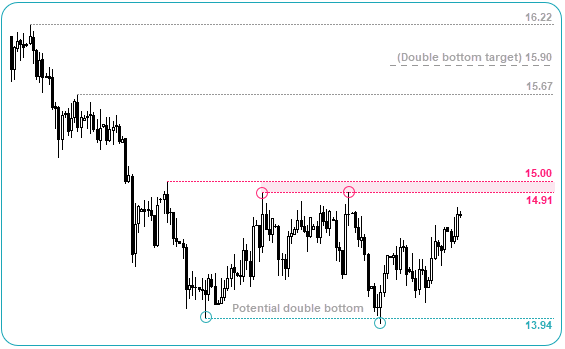
Silver Daily
-
Silver remains in a sideways range, but a clear break above 14.91- 15.00 confirms a double bottom.
-
Range trading strategies are preferred between the 13.94 – 15.00 area.
-
Look for reversal patterns near support and resistance, as they have been a prominent feature of this range.
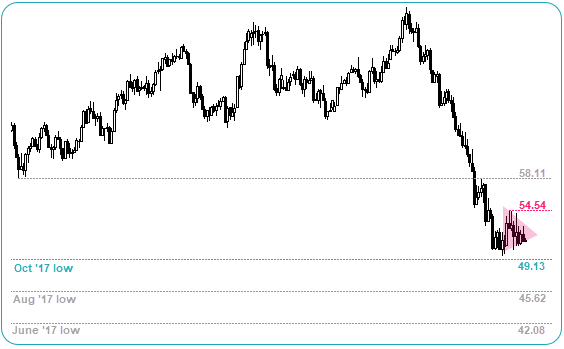
WTI Daily
-
Crude oil is coiling to suggest a volatile move is pending.
-
With the trend clearly bearish, a break of 49.13 brings 45.62 and 42.08 lows into focus.
-
However, the lack of near term mean reversion would mean a counter-trend break above of 54.45 would see likely see a move to the 58.11.
-636802896432111993.png)
Author

Matt Simpson, CFTe, MSTA
CityIndex
Matt Simpson is a certified technical analyst who combines charts and fundamentals to generate trading themes.


