|

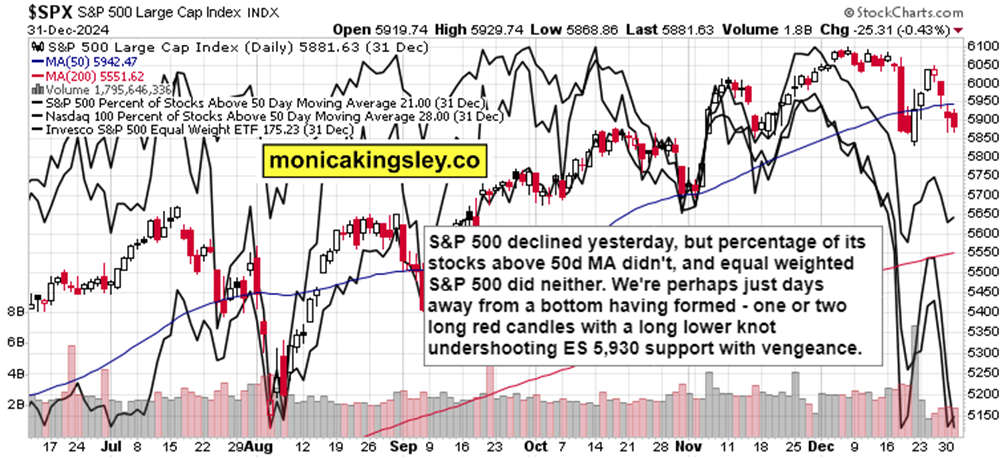
Time to buy this tentative bottom?

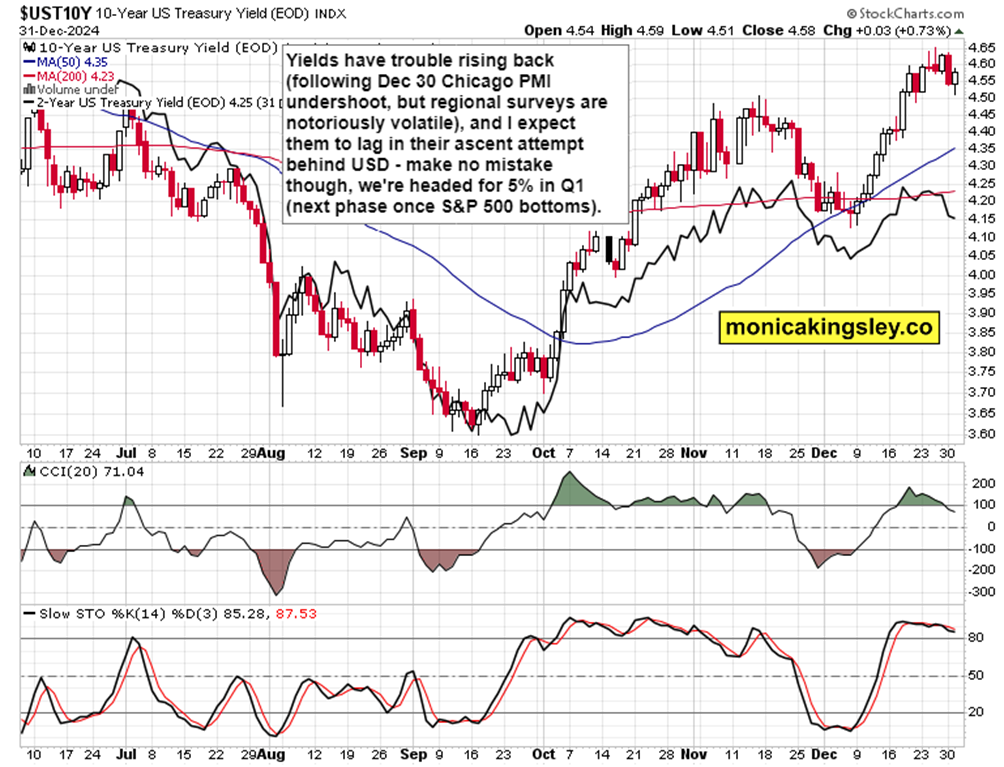
S&P 500 could have put a local bottom Dec 31, but instead we had to wait for today when we got the clear 5,930 breakdown and intraday reversal that I have talked in relation to market breadth developments in yesterday‘s video (forget not to be sending your chart requests for one of the upcoming videos). A slide not brought up there that became since way more prominent in implications, is the Bitcoin chart shown below – affecting through oh so wanted yields retreat precious metals positively. Also oil keeps moving towards my key level given to clients lately.

So what‘s so remarkable about today? Yields daily retreat fueling risk taking, helping Russell 2000 (this one had been only gradually losing altitude, and has MACD histogram as well positioned as S&P 500 (Nasdaq is a laggard in such a daily environment no matter what NVDA does) and crypto surge starting anew.

Let‘s dive into several charts, and continued with many more in the premium section – it‘s the start of the month, let me welcome you and serve you.

Chart
Chart
Chart
Chart

And what follows, is a little preview of the stock market setup – it‘s oversold, but is it enough oversold? We‘re seeing the answer being given as we speak.

Chart

Author

Monica Kingsley

Monica Kingsley

Monicakingsley

Monica Kingsley is a trader and financial analyst serving countless investors and traders since Feb 2020.

More from Monica Kingsley
Share:

Editor's Picks

GBP/USD bounces off lows, back above 1.3200

After bottoming out near 1.3160, GBP/USD manages to regain a bit of shine and reclaim the 1.3200 mark and beyond at the end of the week. Stronger-than-expected UK Retail Sales data seem to be helping the British Pound limit its losses, while the chaotic UK political environment keeps the bulls at bay for now.

EUR/USD looks consolidative around 1.1460

EUR/USD stages a modest rebound after slipping to a three-month low below 1.1420 at the end of the week. That said, the pair now looks to consolidate humble gains just above 1.1460 despite growing uncertainty surrounding the next round of US-Iran negotiations, which keeps the US Dollar’s downside contained.

Gold slips back to six-day lows, targets $4,100

Gold retreats for the third consecutive day on Friday, eroding gains seen in the first half of the week and approaching the key $4,100 mark per troy ounce. Indeed, the precious metal continues to face headwinds from the Fed's hawkish stance and renewed uncertainty surrounding the next round of US-Iran negotiations.

Solana extends correction despite ETF inflows, RWA adoption

Solana (SOL) price edges below $70 extending its losses for the fourth straight day this week. The institutional demand for Solana is building, with steady inflows so far this week and Morgan Stanley’s amended S-1 filing for a Solana-focused Exchange-Traded Fund.

The Iran war didn't break the US economy, but what happens next?

Nearly four months after the start of the Iran war, the US economy remains remarkably resilient. While the conflict initially triggered a severe disruption to global energy markets and a sharp rise in Oil prices, recent diplomatic progress between Washington and Tehran has eased concerns about a prolonged supply shock.

Regime change: Inside Kevin Warsh's first move to make the Fed unreadable on purpose

The rate did not move. That was the least interesting thing about Kevin Warsh's first meeting in charge of the Fed. The FOMC held its benchmark at 3.50%-3.75% for the fourth straight meeting, exactly as priced, and then the new chair used his first press conference to dismantle the machinery the market has leaned on for a decade.