Three Truths about Stock Market Sell-Off Gold Investors Should Know

Until recently, the financial press was reporting confidence in the global economy in 2018. Participants at the World Economic Forum in Davos were full of optimism and they outdid each other in upgrading their forecasts. One week later, the global stock market plunged, making analysts stupefied. “As equities tumbled, gold should shine”, almost everyone thought. But that’s not what we saw. What really happened, then?
Crash or Correction? – That Is the Question
Global equities were a sea of red over the last few days. The U.S. stocks marked their worst falls in more than six years. From Thursday to Monday, the Dow Jones Industrial Average Index tumbled more than 1,800 points, or about 7 percent. The S&P 500 followed suit, as one can see in the chart below. The Wall Street triggered a domino then, pulling Asia and, eventually, Europe down.
Chart 1: Dow Jones (red line, left axis) and S&P 500 Index (green line, right axis) from March 2017 to February 2018.
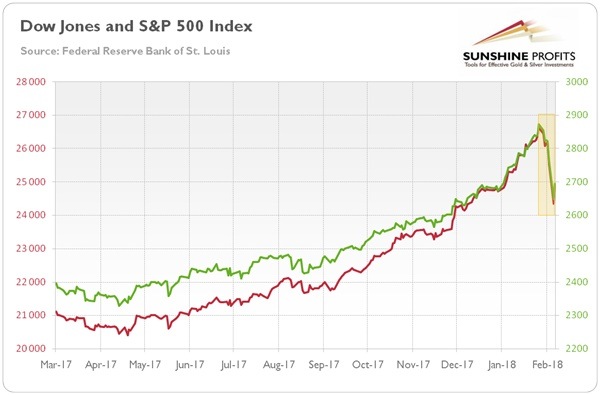
Are we experiencing the next big market crash? Is it the replay of 2008? We don’t think so. For two major reasons. First, the recent declines were not unprecedented. Corrections happen from time to time. Indeed, the Dow Jones sank 4 percent or more almost 40 times over the last thirty years.
Second, fundamentals remain solid. Surely, private and public debt levels are massive and geopolitical tensions are still present. But corporate profits are excellent. The perspectives in Europe are finally promising. Economic growth in the U.S. has been accelerating (the Atlanta Fed GDP model forecasts 5.4 percent growth in the first quarter of 2018). Simply put, no important economic news emerged which could justify a stock market crash. So why did stocks tumble?
But Seriously, What Happened?
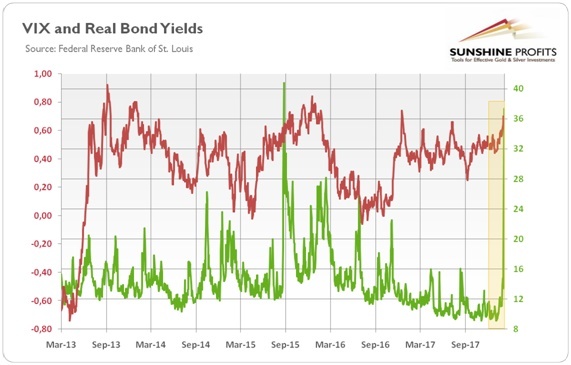
You’re probably wandering what’s going on. Oh, that’s simple, isn’t it? Everyone talks about it. Friday’s surprisingly strong payrolls triggered the declines, it’s obvious. There was a pick-up in wage growth, so investors started to worry about inflation. They feared that the Fed would tighten its stance in response to rising price pressures. Bond yields soared and volatility surged, as the next chart clearly shows.
Chart 2: CBOE Volatility Index (green line, right axis) and 10-year inflation-indexed Treasuries (red line, left axis, yield in %) from March 2013 to February 2018.
And all this occurred during the Fed Chair transition (on Monday, Jerome Powell was formally sworn chairman of the Federal Reserve, replacing Janet Yellen in this position). Investors re-evaluated their holdings in a higher than previously anticipated interest rate environment and decided to sell stocks. Sounds convincing?
Of course, it does. That’s how the human brains work. We love seek causal explanations, even if they don’t exist. But this is extremely dangerous in the case of investing. As Benjamin Graham pointed out, the market is a voting machine in the short run.
Look at the chart above once again. You will see that real interest rates actually dropped on Monday. Funny, huh? And now let’s return to Chart 1 (or move on to Chart 3) – as you can see, the S&P 500 Index started to decline at the end of January, before the release of the Employment Situation report.
Implications? Don’t impute intelligence to the market. In the short run, it’s not about fundamentals, but rather it’s a barometer of the investors’ sentiment, very sensitive to emotional swings. The truth that others analysts won’t tell you is simple: the markets were down just because they previously had gone too far too fast. We would be worried if there was no correction at all, actually.
Stocks Tumbled, so Gold Should Shine, Right?
Wrong. As we explained in the simple definition of the S&P 500, the gold-stocks relationship changes over time, depending on external conditions. The link between the S&P 500 and gold is complex and dependent on external macroeconomic factors – as the chart below presents, there are periods of co-movement.
Chart 3: Gold prices (yellow line, left axis) and S&P 500 Index (green line, right axis) from March 2013 to February 2018.
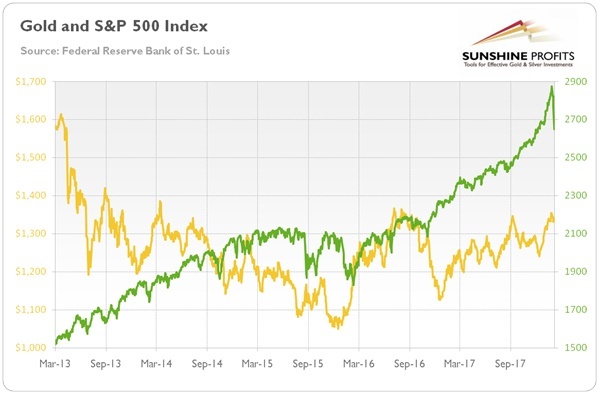
Using our Correlation Matrix, you can clearly see that the correlation between gold and the U.S. stocks is positive in the short run. The recent co-movement is thus in line with our predictions.
And what is ahead of us? Well, given that the recent declines in the stock market are likely to be a temporary pullback and not a start of the bear market, risk appetites could return to the market. When the markets calm down, the safe-haven demand for gold should diminish. We know that gold rallied before the turmoil. And indeed gold remains a viable hedge against both inflation and stock market crashes (but not necessarily in the short run). However, the recent rebound in the U.S. dollar is likely to put pressure on the yellow metal in the near future. Remember that the greenback – not the stock market – is the key gold driver now. Stay tuned!
Want free follow-ups to the above article and details not available to 99%+ investors? Sign up to our free newsletter today!
Author

Arkadiusz Sieroń
Sunshine Profits
Arkadiusz Sieroń received his Ph.D. in economics in 2016 (his doctoral thesis was about Cantillon effects), and has been an assistant professor at the Institute of Economic Sciences at the University of Wrocław since 2017.


