|

There is no reason to sell iShares Silver trust

The iShares Silver Trust (SLV) is an exchange-traded fund (ETF) that tracks the price performance of the underlying holdings in the London Bullion Market Association (LBMA) Silver Price as of August 2014. If you’re interested in investing in silver, SLV provides exposure to the silver market without the need to physically hold the metal.

SLV 360 Min Chart May 7th

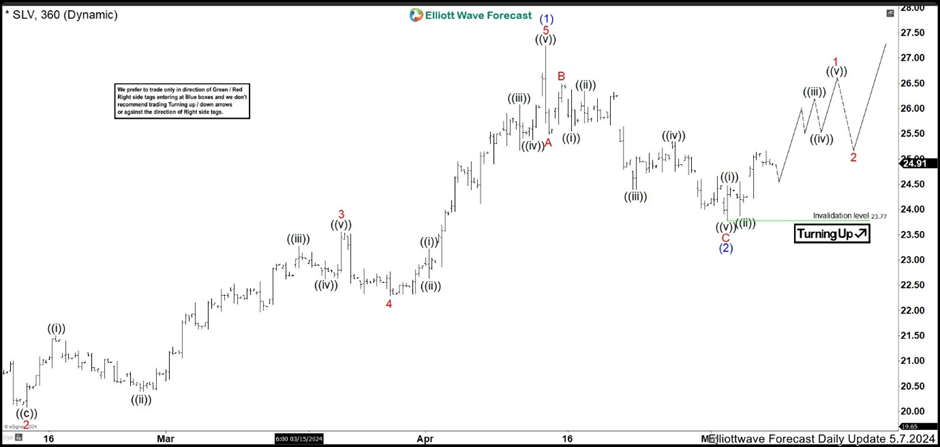
At the beginning of 2024, SLV resumed the bullish trend after a year of sideways movement. We think that the low of 01/22/2024 at 20.07 started the new cycle higher and we called as wave ((2)). From this point, we are looking to develop an impulse as ((3)). In the chart above from May 7th, we can see clearly an impulse wave (1) of ((3)) ended at 27.24. Then, market entered in a pullback as wave (2) building a zig zag correction. The ABC structure ended at 23.78 low in May and rallied again. (If you want to learn more about Elliott Wave Theory, please follow these links: Elliott Wave Education and Elliott Wave Theory).

SLV 240 Min Chart May 20th

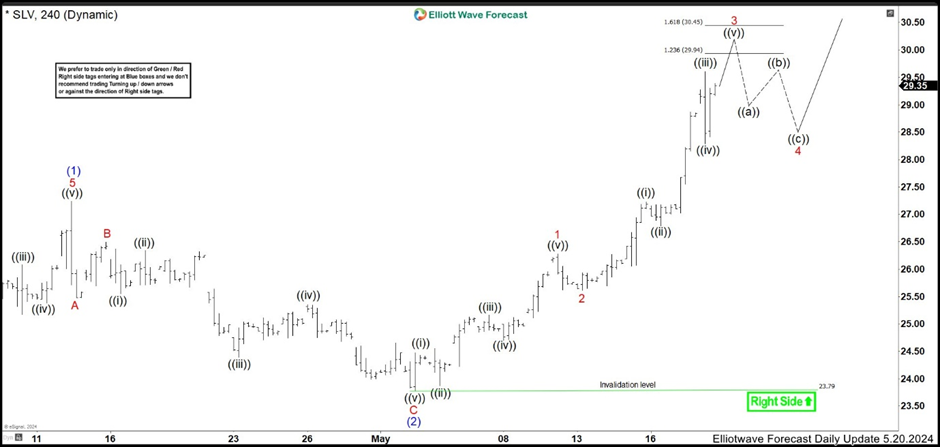
Two weeks later, SLV has made a strong rally breaking above wave (1) high; therefore, we are already trading in wave (3) of ((3)). Up from 23.78 low, wave 1 ended at 26.28 and pullback as wave 2 completed at 24.70 low. Then, market remained bullish starting wave 3 of (3). Currently, we are calling for one more high to end wave ((v)) of 3. If there is not more extensions in wave 3, it should finish in 29.94 – 30.45 area before starting a correction in wave 4. Once wave 4 is ended in 3, 7 or 11 swings correction, we should looking for buying opportunities.

Author

Elliott Wave Forecast Team

Elliott Wave Forecast Team

ElliottWave-Forecast.com

More from Elliott Wave Forecast Team
Share:

Editor's Picks

EUR/USD weakens to near 1.1900 as traders eye US data

EUR/USD eases to near 1.1900 in Tuesday's European trading hours, snapping the two-day winning streak. Markets turn cautious, lifting the haven demand for the US Dollar ahead of the release of key US economic data, including Retail Sales and ADP Employment Change 4-week average.

GBP/USD stays in the red below 1.3700 on renewed USD demand

GBP/USD trades on a weaker note below 1.3700 in the European session on Tuesday. The pair faces challenges due to renewed US Dollar demand, UK political risks and rising expectations of a March Bank of England rate cut. The immediate focus is now on the US Retail Sales data. 

Gold drifts lower as positive risk tone tempers safe-haven demand; downside seems limited

Gold drifts lower during the Asian session on Tuesday and snaps a two-day winning streak, though it lacks strong follow-through selling and shows some resilience below the $5,000 psychological mark amid mixed cues. The outcome of Japan's snap election on Sunday removes political uncertainty, which, along with signs of easing tensions in the Middle East, remains supportive of the upbeat market mood.

Bitcoin Cash trades lower, risks dead-cat bounce amid bearish signals

Bitcoin Cash trades in the red below $522 at the time of writing on Tuesday, after multiple rejections at key resistance. BCH’s derivatives and on-chain indicators point to growing bearish sentiment and raise the risk of a dead-cat bounce toward lower support levels.

Follow the money, what USD/JPY in Tokyo is really telling you

Over the past two Tokyo sessions, this has not been a rate story. Not even close. Interest rate differentials have been spectators, not drivers. What has moved USD/JPY in local hours has been flow and flow alone.

Bitcoin Cash trades lower, risks dead-cat bounce amid bearish signals

Bitcoin Cash (BCH) trades in the red below $522 at the time of writing on Tuesday, after multiple rejections at key resistance. BCH’s derivatives and on-chain indicators point to growing bearish sentiment and raise the risk of a dead-cat bounce toward lower support levels.