The USD showed the potential to breakdown against many majors
The Basic Technical Analysis Perspective
The USD (DXY) has been range bound for months, and mostly this is a product of many cross currents in the markets. Equity market volatility, weakness of fundamental data globally stating to seep in, the FOMC looking to be at the end of their hike cycle, China and US trade war brewing, and the list can go on an on. The problem is that the market is pretty long the US Dollar as a whole and the risk is increasing that a squeeze could be on the horizon. For USD longs it could be a liquidation, for the EUR, AUD, NZD, CAD and GBP we could get a squeeze.
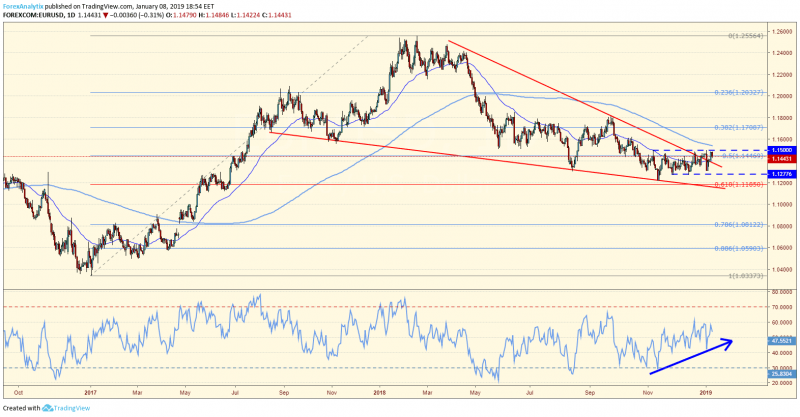
I think it's time that we take a look at the pairs listed above and see what the longer term charts look like. The EURUSD is probably the one pair that has really kept the DXY (US Dollar Index) sidelined as we have been in a range since October. The sub 1.1300 level has offered great support, and resistance has been at 1.1500. However, in recent days the EURUSD finally broke the longer term downtrend line that has held down the pair for most of 2018. With the RSI divergent and now "mid range" the risk is building for an upside breakout.
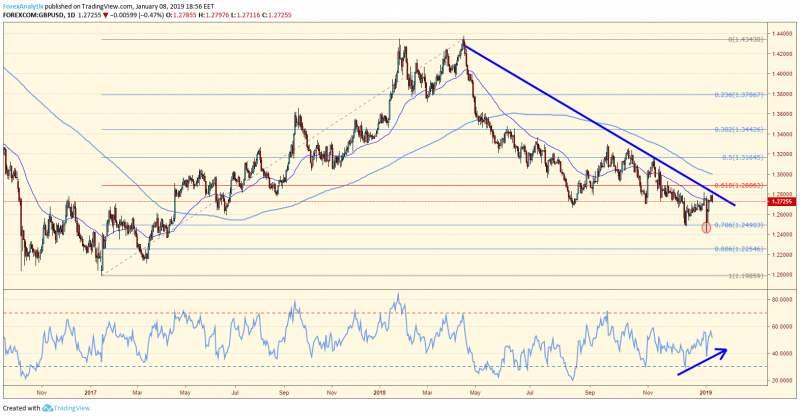
Another currency pair with a massively divergent RSI on the daily chart is the GBPUSD. The GBPUSD has been held hostage by the constant news stream surrounding the BREXIT headlines. The move last week in Asian trade stopped out near term longs below the 1.2500 level, and any positive news on the BREXIT front in the coming week(s) could lead to a much higher move as the market is net short still.
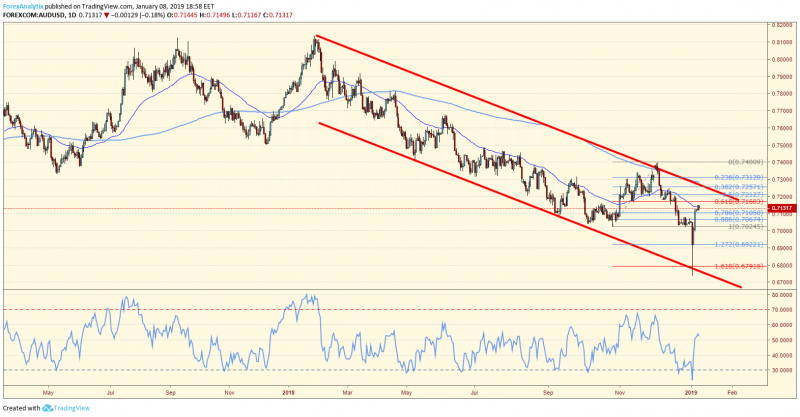
The AUDUSD had moved aggressively lower last week following the Asian "flush" in the market as well. The pair took out long time sell stops before reversing this week. Any positive developments between China and the US could lead this pair a lot higher towards the 200dma as well.
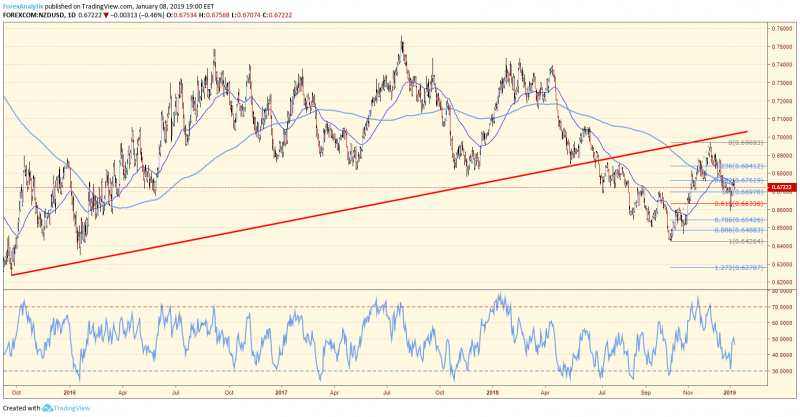
The NZDUSD has held steady (remarkably) in recent months to a longer term range which could lead to a move back towards the .7000 level if we see broad based US Dollar weakness.
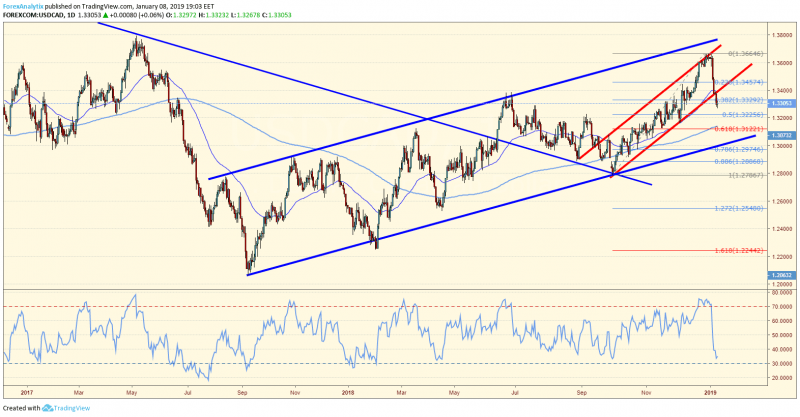
The last pair I wanted to discuss in the USDCAD. This pair had caught the market off guard with the USMCA agreement passing, the market had assumed the CAD would get a relief rally, but instead the weakness in crude oil had caused a CAD liquidation leading the USDCAD from 1.2800 to north of 1.3600. But with the US economy faltering, and the BOC set to raise rates (and possibly normalize) the USDCAD may be at risk of another move to 1.3000, especially given that we have broken out of the year and a half up channel.
The US Dollar looks poised for a move lower, at least near term. With the FOMC seeing rates fairly neutral, US Dollar long positioning lopsided, recent strength in the bond market, possible BREXIT deal upon us, and the risk that the China/US trade war may simmer down in the near future, this could set the stage. Let's hope so, the sideways price action in the Forex market as of late is not what us volatility seekers want.
An Elliott Wave Path Suggests More Short-term Gains For CAD as Oil Turns Up
Commodity currencies made an impressive turnaround against the USD since the start of the year. We see the NOK, CAD, NZD and AUD being very strong in particular, which may have something to do with higher crude oil and metals over-performance, despite the bounce on stocks. Under a risk-on environment there may be more dollar weakness ahead and in current circumstances this may cause opportunities to catch some upside on CAD, AUD and others as price action is concerned.
My attention today will be on the USDCAD as this one can be turning down from the upper side of a leading diagonal. So despite the bullish run in 2018 I think there is a chance for a move lower from here. On smaller time frames the decline looks clearly impulsive from 1.3660 so it's seen as only the first leg within a deeper correction that can take price even back down to 1.3000 level. Having said that, we know that nothing moves in a straight line, so I would like to observe a rally within wave B) which I think may be a nice shorting opportunity for a drop into wave C). If I am on the right track then expect resistance at that broken channel line and near the 1.3442 swing.
When I trade, I like to check correlated markets so in this case I am interested to see what OIL is doing before looking for any CAD trade. Well, notice that Oil is making a very nice rise, also breaking above the channel resistance which can produce more gains ahead, especially if we see an overlapping with $50.50 as this one would confirm a low in place and a turn in price. That would increase the likelihood that the USD should suffer more against CAD.
Author

Stelios Kontogoulas
Forex Analytix
Stelios was fascinated by computers from a very young age and went on to study Computer Science at Imperial College. Following a 5-year IT consulting career (having worked for Accenture among others), he felt unfulfilled and wanted to make a change.


