The trend is starting to deliver


This week has once again proven that key technical levels matter.
The support and resistance zones we've been tracking over the past several weeks continue to dictate price action across multiple markets. One by one, markets are either reaching their projected targets or confirming the scenarios we've been discussing for weeks.
At the same time, many instruments are now approaching the next major decision points. The next meaningful move - and potentially a shift in the bigger picture - will likely depend on whether buyers or sellers can finally break through these key technical barriers.
Dollar (DX.F)
Let's begin with a quote from our previous Lab:
“(…) traders should remember one important thing.
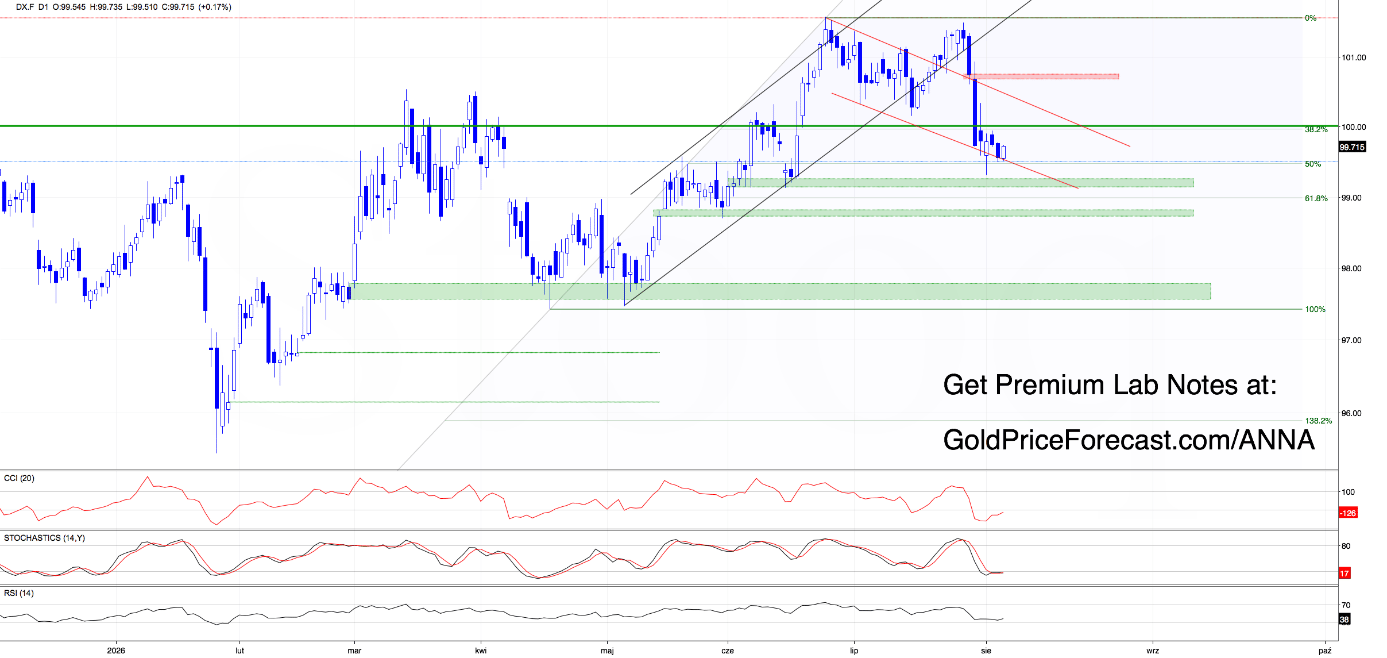
As long as we don't see a daily close back above 100, today's rebound looks more like a verification of the recent breakdown below both July consolidations. Those lower boundaries now form a resistance zone between 100.14-100.32.
(…) For now, sellers still have the technical advantage, and yesterday's bearish scenario remains active. As a reminder:
“(…) yesterday's close below the black ascending channel activated a broader bearish scenario, opening the door for a move toward 99.50 if the psychological 100 level is broken. (…)”
From today's perspective, the market has continued to develop exactly in line with Friday's bearish scenario. On Monday, the U.S. dollar reached our downside target - congratulations to everyone who stayed patient and followed the bearish outlook.
Despite this week's rebound, the greenback has still failed to reclaim the psychological 100 level. Instead, the recovery once again turned into a pullback and a retest of both the downside target and the lower boundary of the red declining channel.
So, what comes next?
Despite three tests, the support zone built around the lower boundary of the channel and the 50% Fibonacci retracement continues to hold, increasing the probability that buyers may be preparing for another attempt to reclaim the 100 level, which now acts as the first major resistance.
However, our broader outlook remains unchanged.
Only an invalidation of the earlier breakdown below this key level would confirm that buyers have regained control and are ready to challenge higher prices.
Until then, sellers continue to hold the technical advantage, especially with momentum indicators still failing to generate fresh buy signals.
Platinum (PL.F)
Let's begin with a reminder from last week's Lab:
“(…) A daily close above 1663 or below 1553 is still required before expecting a meaningful directional move. (…)”
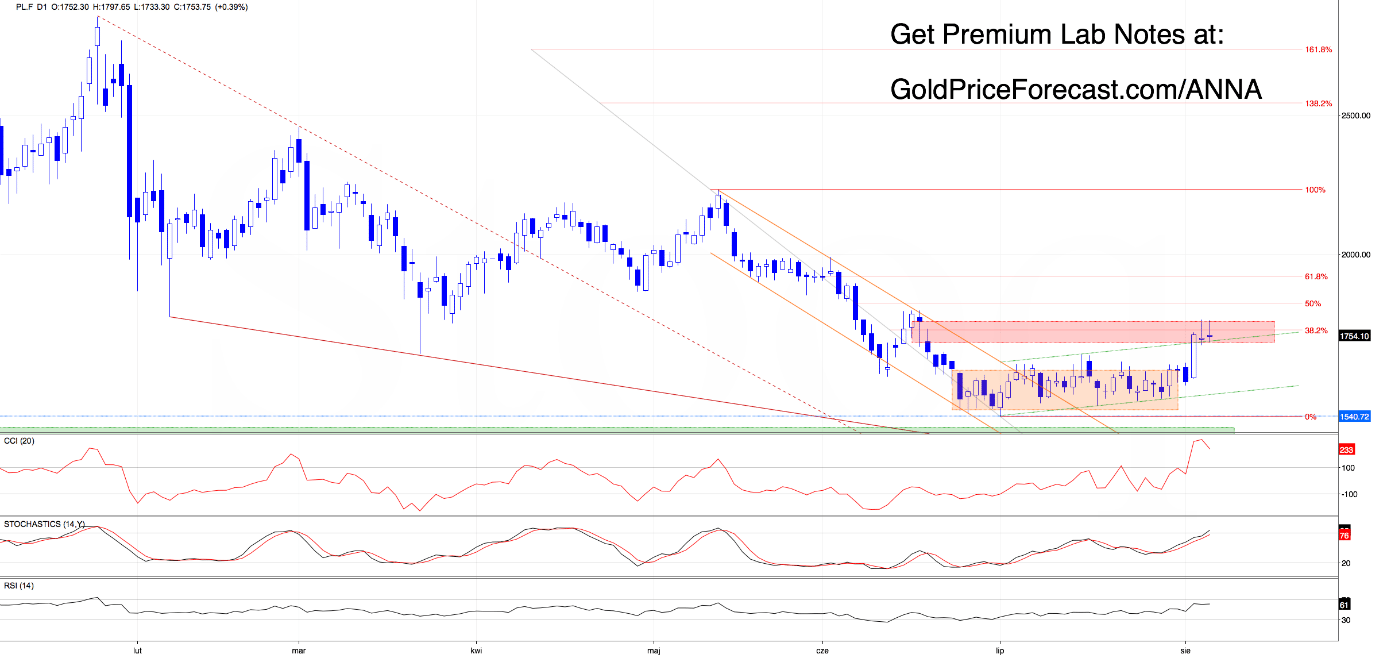
After weeks of consolidation, platinum finally delivered the breakout above 1663, activating the bullish scenario we outlined at the beginning of July. As a reminder:
“(…) A move above 1662 wouldn't simply close the bearish gap - it would also trigger a breakout from the orange consolidation that's been containing price over the past several sessions.
(…) What happens if buyers manage to break out?
A confirmed breakout would open the door toward the upper boundary of the orange declining channel. Clearing that obstacle would shift attention to the next resistance zone around 1700-1707 (June 19 bearish gap). If buyers manage to close that gap as well, the next upside target becomes 1736-1792 (June 18 bearish gap).(…)”
From today's perspective, the market has continued to follow that scenario almost perfectly, reaching our final upside target. Congratulations to everyone who stayed with the trade!
So, what now?
Despite two attempts, the upper boundary of the June 18 bearish gap (1736-1792) continues to hold, which means the gap remains active.
Therefore, only a daily close above 1792 would open the door toward the 1824-1848 resistance zone and potentially even the psychological 1900 level.
In our opinion, as long as platinum remains above the upper boundary of the green ascending channel - which recently replaced the triangle formation - buyers continue to hold the technical advantage.
Palladium (PA.F)
Let's start with Friday’s quote:
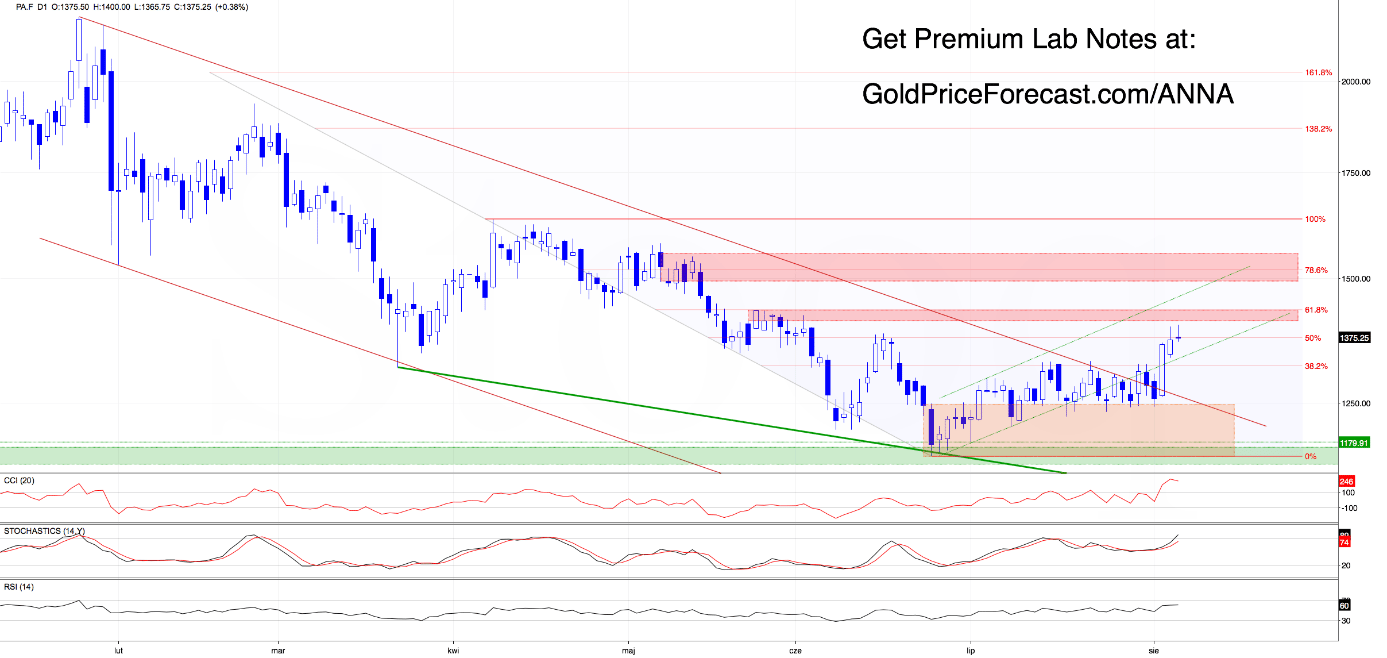
“(…) If today's session closes below both resistance lines, yesterday's downside target - a retest of the 1250 area - becomes active once again.(…)”
From today’s perspective, we see that Monday brought another successful test of the 1250 support zone (as expected).
Once again, buyers stepped in, pushing the price back above the upper boundary of the red declining channel, the lower boundary of the green ascending channel, and successfully closing the bearish gap between 1324-1363.
This display of strength has shifted momentum back toward the buyers, which suggests that the next upside target would likely be the 1430 area.
Copper (HG.F)
Let's begin with a quick reminder from last week's Lab:
“(…) What would invalidate the bearish scenario? A daily close above 650.(…)”
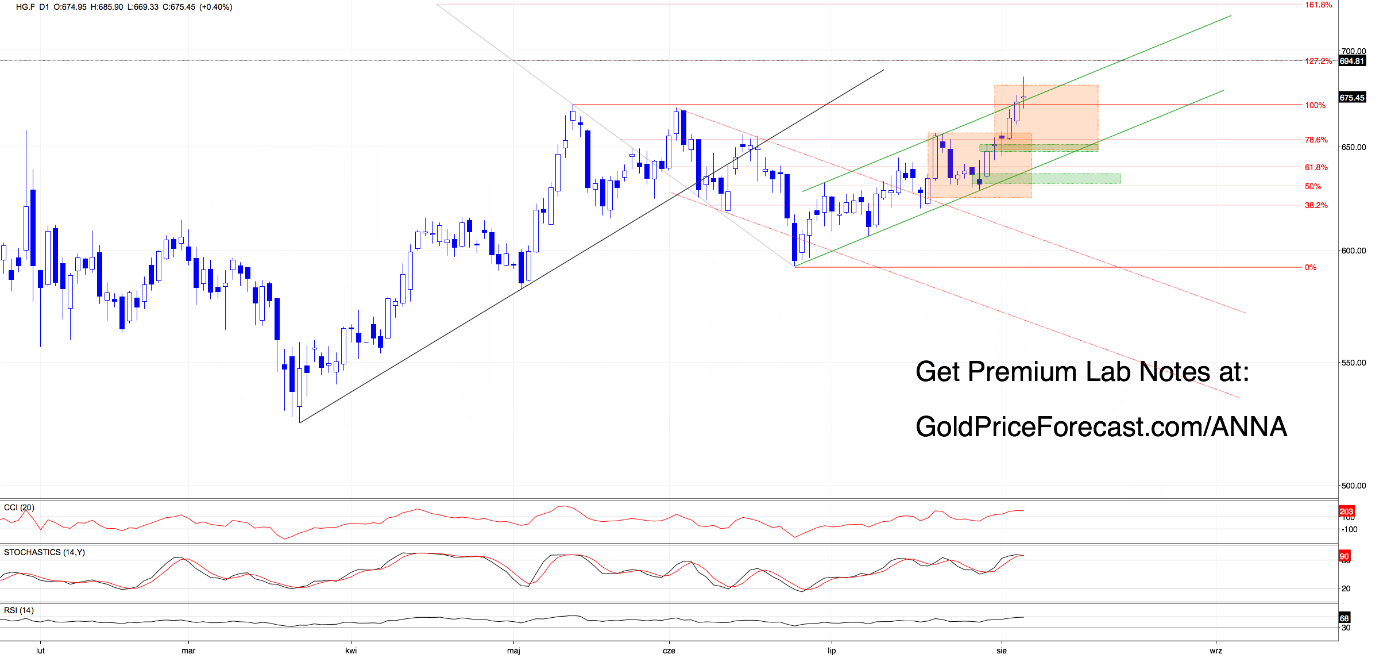
Despite intraday volatility, buyers managed to finish Friday above 650, closing the bearish gap and invalidating the previous bearish scenario (that alone was another reminder of how important daily closes are compared to intraday noise).
Monday added another bullish gap (651-655), which successfully absorbed selling pressure and confirmed that buyers remain committed to higher prices.
The market responded quickly.
Copper broke above the orange consolidation and activated the bullish scenario we discussed on July 21, bringing our previously projected upside targets back into play. As a reminder:
“(…) If buyers can finish (…) session above 649.35, the odds of breaking out of the green channel increase significantly, opening the door toward the upside targets we discussed last week: 675.43 (161.8% Fibonacci extension) and potentially the 692-700 zone (…)”
Today, buyers hit a new high at 685.90, successfully achieving both the minimum measured move from the recent consolidation breakout and our first above-mentioned upside target. Congratulations to everyone who remained patient and trusted the bullish outlook!
The recent rally has triggered a modest pullback as traders take profits, however, as long as copper remains above the 669-671 support zone (the previously broken peaks) and the upper boundary of the green ascending channel, further gains remain possible.
The next upside target continues to be the 692-700 area.
Nevertheless, please keep in mind that a daily close below 669 would be the first signal that a deeper correction may be starting.
Today's takeaways
Dollar (DX.F)
• Watch 100 & the 100.14-100.32 resistance zone.
• Buyers need a daily close back above 100 to invalidate the recent breakdown.
• Until then, sellers remain in control despite this week's rebound.
Platinum (PL.F)
• The 1736-1792 bearish gap remains the key resistance.
• A daily close above 1792 opens the door toward 1824-1848 and potentially 1900.
• Buyers remain in control while price stays above the green ascending channel.
Palladium (PA.F)
• Monday's defense of 1250 keeps the bullish scenario alive.
• Watch the next resistance zone around 1388-1430 & support area around 1310-1325
• The next upside target -> 1430.
Copper (HG.F)
• Watch the 669-671 zone.
• As long as price remains above it, the next upside target stays at 692-700.
• A daily close below 669 would be the first warning that a deeper pullback may be underway.
Wait for confirmation, protect your capital, and stay one step ahead.
Want free follow-ups to the above article and details not available to 99%+ investors? Sign up to our free newsletter today!
Author
















