The surprising rise of Oracle: How it’s defying market trends? [Video]
![The surprising rise of Oracle: How it’s defying market trends? [Video]](https://editorial.fxstreet.com/images/Markets/Equities/SP500/wall_street_nyse2-637299021353183737.jpg)
Oracle Corporation (ORCL) is one of the largest software companies in the world. It provides enterprise database, hardware and middleware solutions, cloud solutions and various enterprise-grade application softwares. It is also a forerunner on subscription based cloud solutions. ORCL is listed on NYSE and is a component of S&P 500 under Information Technology.
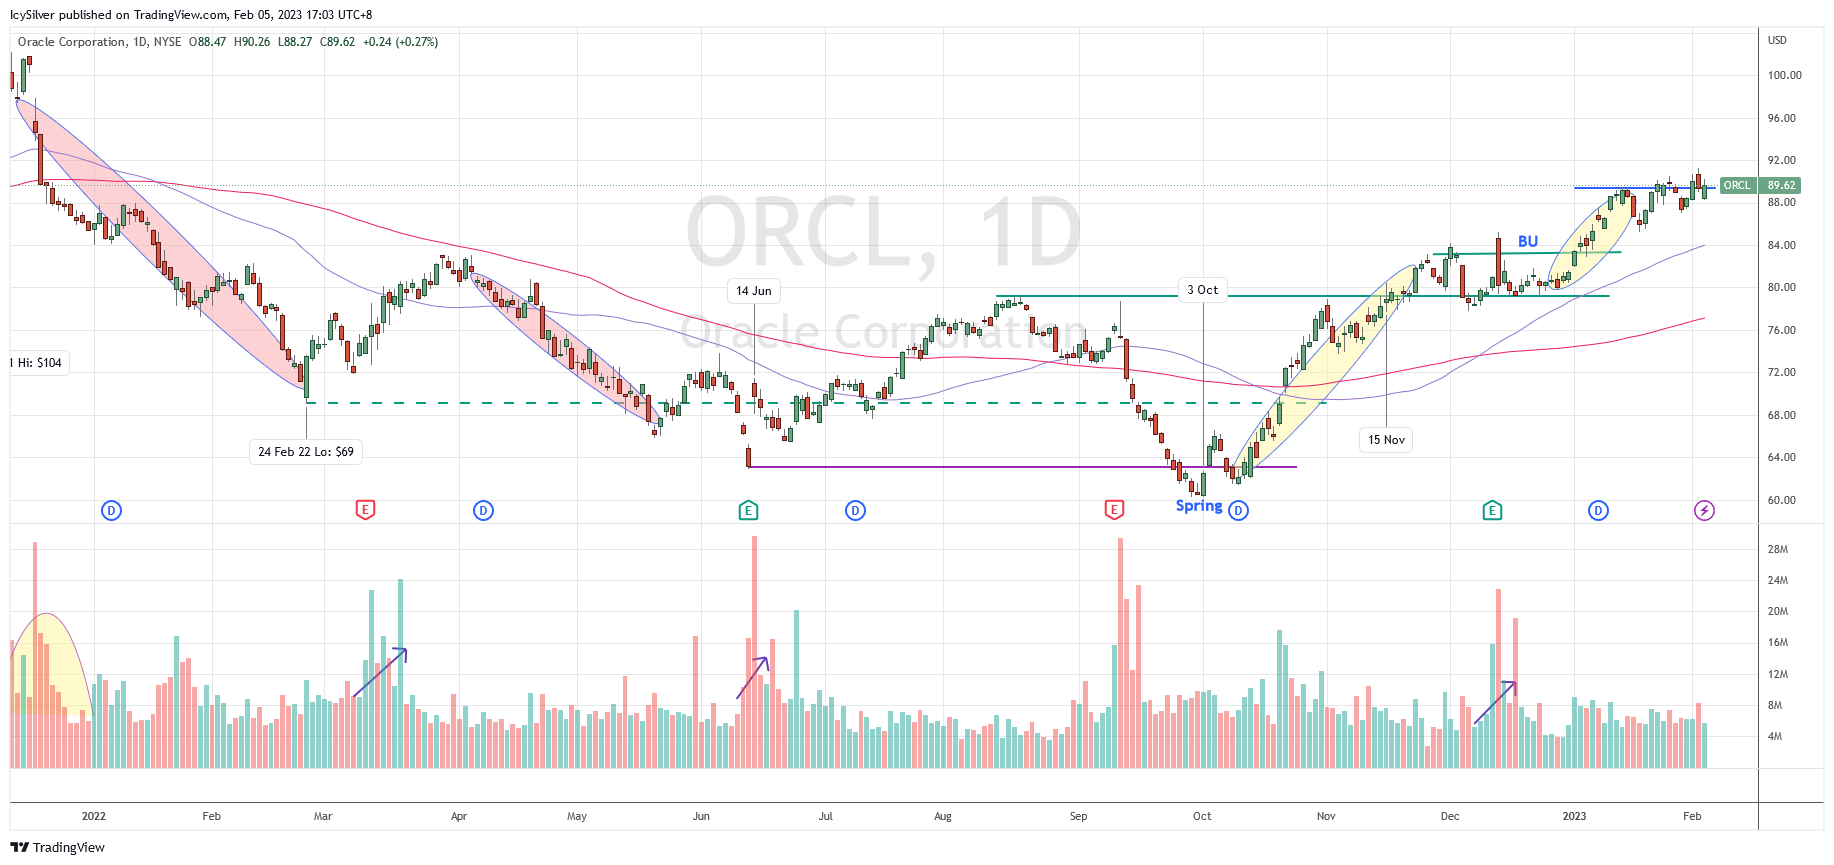
ORCL price hit an all time high of $104 on 10 Dec 2021. The price reacted with a Wyckoff change of character and sign of weakness (SOW). This was accompanied by an increase in volume suggesting the presence of supply as the Wyckoff distribution was unfolding. The price hit a low around $69 on 24 Feb 2022 followed by an automatic rally, with the price touching $83. The down trend could be stopped and became a trading range from here on.
Although the price gap down to $63 on 13 June, the subsequent reaction was a reversal gap up and higher low. The spike in volume suggests the presence of demand. The price then moves in a range between $63 and $79 with characteristics of the Wyckoff accumulation phase. It broke below $63 and did a Wyckoff spring on 3 Oct followed by a successful higher low test. The next price action was a Wyckoff sign of strength (SOS) rally, which confirmed the low was formed during the Wyckoff spring.
This was the best rally so far and it broke above $79 on 15 Nov, and subsequently committed above this level. The range of $79 and $83 became the Wyckoff back up phase and immediate support zone for the price. The price continued to rally and is now testing the resistance at $89.
Bias
Bullish. According to the Wyckoff method, ORCL has completed the accumulation phase of several months and is now testing resistance. It will likely rally up to challenge the all time high of $104.
If the price breaks below $85, it will then retest the support zone of $79 and $83.
ORCL was discussed in detail in my weekly live group coaching on 24 Jan 2023 before the market opened. The improving market breadth together with many bullish trade entry setups could suggest a new bull run as discussed in the video below in detailed.
Author

Ming Jong Tey
Independent Analyst
Ming Jong Tey has been trading since 2008. He started his learning journey from technical analysis (indicators, Fibonacci, etc...) to value investing. Throughout his journey, he develops an interest in price action with chart pattern trading.

















