The stock market with five planetary polarity points plus several more major aspects

This month’s letter covers November 1st through November 28th .
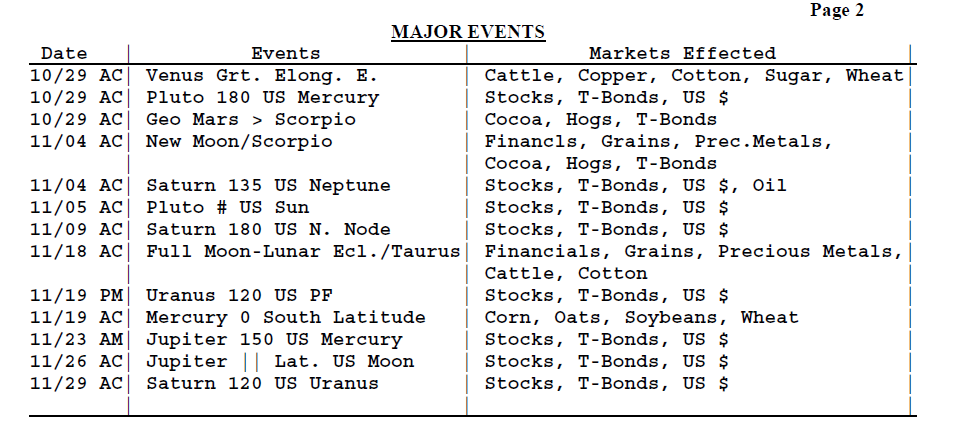
The November major planetary events can be sorted into four segments.
Editor’s Note: Please assume Stocks are affected by all listed events, unless stated otherwise.
1. A. 10/29 AC -" Venus Greatest Elongation East. Major change in trend Cattle, Copper, Cotton, Sugar, Wheat.
B. 10/29 AC -" Pluto 90 US Mercury. Major change in trend US Stocks, T-Bonds, US Dollar.
C. 10/29 AC -" Geo Mars enters Scorpio. Important change in trend Cocoa, Hogs, and T-Bonds.
2. A. 11/04 AC -" New Moon in Scorpio. Major change in trend Financials, Grains, Precious Metals and especially Cocoa, Hogs, & T-Bonds.
B. 11/04 AC -" Saturn 135 US Neptune. Moderate change in trend US Stocks, T-Bonds, US Dollar, & Oil.
C. 11/05 AC -" Pluto Contra-Parallel US Sun. Major change in trend US Stocks, T-Bonds, US Dollar.
D. 11/09 AC - Saturn 180 US North Node. Major change in trend US Stocks, T-Bonds, US Dollar.
3. A. 11/18 AC -" Full Moon/Lunar Eclipse in Taurus. Major Change in Trend Financials, Grains, Precious Metals and especially Cattle and Cotton.
B. 11/19 PM -" Uranus 120 US Part of Fortune. Major change in trend US Stocks, T-Bonds, US Dollar.
C. 11/19 AC -" Mercury 0 South Latitude. Major change in trend Corn, Oats, Soybeans, Wheat.
4. A. 11/23 AC -" Jupiter 150 US Neptune. Moderate change in trend US Stocks, T-Bonds, US Dollar, & Oil.
B. 11/26 AC -" Jupiter Parallel Latitude US Moon. Major change in trend US Stocks, T-Bonds, US Dollar.
C. 11/29 AC -" Saturn 120 US Uranus. Major change in trend US Stocks, T-Bonds, US Dollar.
November 2021 market monitor list
The November planetary analysis indicates that the best areas to monitor this month are: 1) T-Bonds; 2) Stocks; 3) Oats; 4) Wheat; 5) Soybeans; 6) Corn; 7) US $; 8) Cocoa & Hogs; 9 tie) Cattle & Cotton; 10) Tokyo Stock Exchange; 11) Oil; 12) C.I../CRB; 13 tie) Gold & OJ; 14) Copper; and 15) Sugar.
Stocks
10/01 SPX CL 4357.04.
10/29 SPX CL 4605.38.
October Review -" “October should be a volatile, wild and swinging month for the Stock Market with five Planetary Polarity Points plus several more major aspects. Following is a summary of the top ten events or windows: 10/05 AC -" Jupiter Parallel Latitude Neptune, a New Moon, and Pluto turns Direct;10/10 AC - Saturn turns Direct: 10/14 AC -" Mercury 0 North Latitude; 10/15 AC -" Neptune 90 US Mars and Jupiter turns Direct; 10/18 AM -" Mercury turns Direct;10/19 AM -" Helio Saturn 90 Uranus; 10/19 AC -" Mercury Perihelion and 10/20 AM -" Full Moon; 10/22 AC -" Mercury Greatest Elongation West and Uranus 90 US MC; 10/29 AC -" Venus Greatest Elongation East, Pluto 180 US Mercury & Geo Mars enters Scorpio.
Near term, the Stock Market had a strong down trend for most of September. The rally on 10/1 into our 10/1 AC change in trend window suggest a high for Monday. If that is the case, there should be a decline into our huge 10/5 AC change in trend window. If the market rallies past Monday, then expect a rally high into 10/6.”
Results
Market Math -" 10/6 -" 4,597 Music Days from the 3/06/2009 major low. 10/6 was a re-test of the 10/4 low of the month and a very good low. Score -" 1 out of 1 = 100%.
Fibonacci -" 10/6, 10/15, 10/18, 10/29 10/6 was a re-test of the 10/4.
low of the month and a very good low. 10/15 and 10/18 were not effective. Score -" 1 out of 3 good dates = 33.34%
Astro -" 10/4, 10/6, 10/11, 10/14, 10/15, 10/20, 10/25, 10/29 AC.
10/4 was the exact low of the month. 10/6 was a re-test of the 10/4 low of the month and a very good low. 10/11 was a pass. 10/14 was a breakout buy over a downtrend. 10/15 and 1020 were not effective. 10/25 was close in price and one day ahead of a short term high. Score -" 4 out of 6 good dates.
Total Score -" 6 out of 10 good dates = 60%.
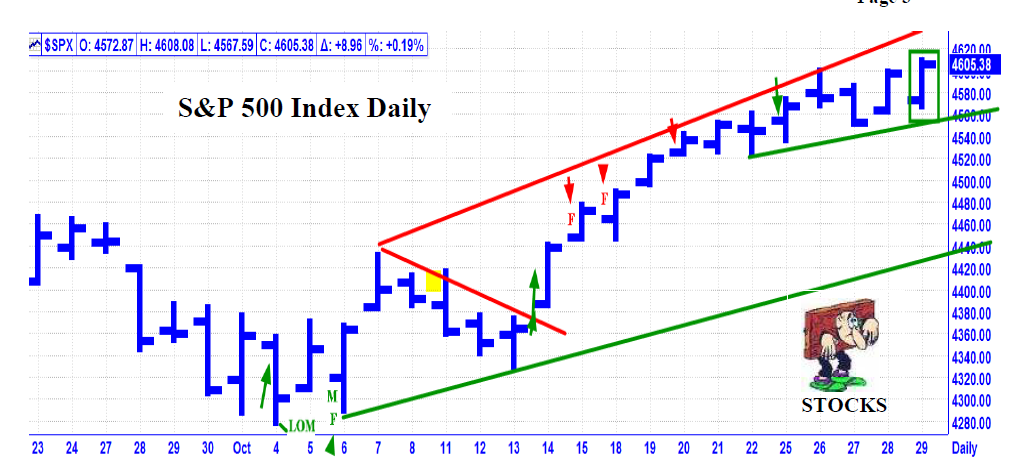
LEGEND: If it is Green it is a winner. If it is Red it is a miss. A Green encircled bar at the end of the month, is still open to evaluation due to a lack of time. A Yellow Bar is a Pass. Astro Date = Arrow. D = DJIA. F = Fibonacci. M = Market Math. N = NYSE. S = S&P. U = US Fed. B = BankEn/Fed. LOM = Low of the Month. HOM = High of the Month.
Author

Norm Winski
Independent Analyst
www.astro-trend.com


