The S&P 500 makes a new all-time high at 4743.83

11/22 Recap: - The S&P opened with a 14 handle gap up and then traded another 32 handles higher into a 10:16 AM high of the day and new all-time high. From that high, the S&P declined 43 handles into an 11:58 AM low. From that low, the S&P rallied 31 handles into a 3:12 PM high. From that high, the S&P declined 49 handles, closing near the low of the day.
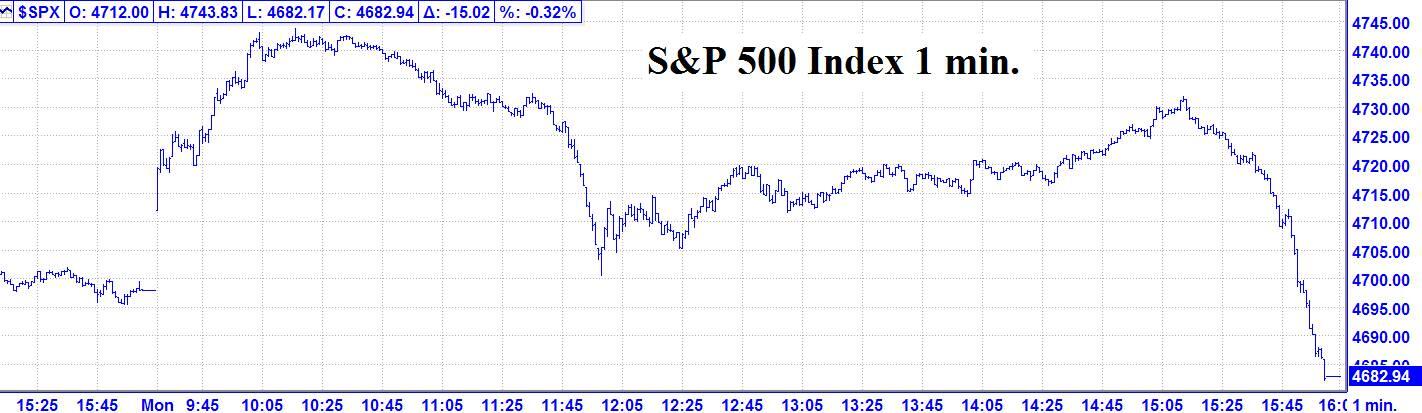
1/22 – The DJIA closed slightly higher while the three major indices closed with moderate to large down closes, following a large morning rally per the following closes: The DJIA + 17.27; S&P 500 - 15.02; and the Nasdaq Composite – 202.68. Please note that from their intra-day highs, all three indices had substantial declines into the close. The S&P 500 made a new all-time high at 4743.83 and the Nasdaq Composite made a new all-time high at 16,212.23.
Looking ahead – With Mercury hitting 0 South Latitude at 9:35 AM, Monday was a classic reversal top, coming at 10:16 AM, leading to a decline of more than 60 handles. The most likely path is a further decline or consolidation into our next major change in trend window at the end of this week.
The NOW Index is in the NEUTRAL ZONE.
Coming events
(Stocks potentially respond to all events).
3. B. 11/19 PM – Uranus 120 US Part of Fortune. Major change in trend US Stocks, T-Bonds, US Dollar.
C. 11/19 AC – Mercury 0 South Latitude. Major change in trend Corn, Oats, Soybeans, Wheat.
4. A. 11/23 AC – Jupiter 150 US Neptune. A moderate change in trend US Stocks, T-Bonds, US Dollar, & Oil.
B. 11/26 AC – Jupiter Parallel Latitude US Moon. Major change in trend US Stocks, T-Bonds, US Dollar.
C. 11/29 AC – Saturn 120 US Uranus. Major change in trend US Stocks, T-Bonds, US Dollar.
Stock market key dates
Market Math
11/29 – 5,161 Music Days from the major 10/11/2007 high.
Fibonacci – 11/19-22, 11/26.
Astro – 11/19, 11/22, 11/26
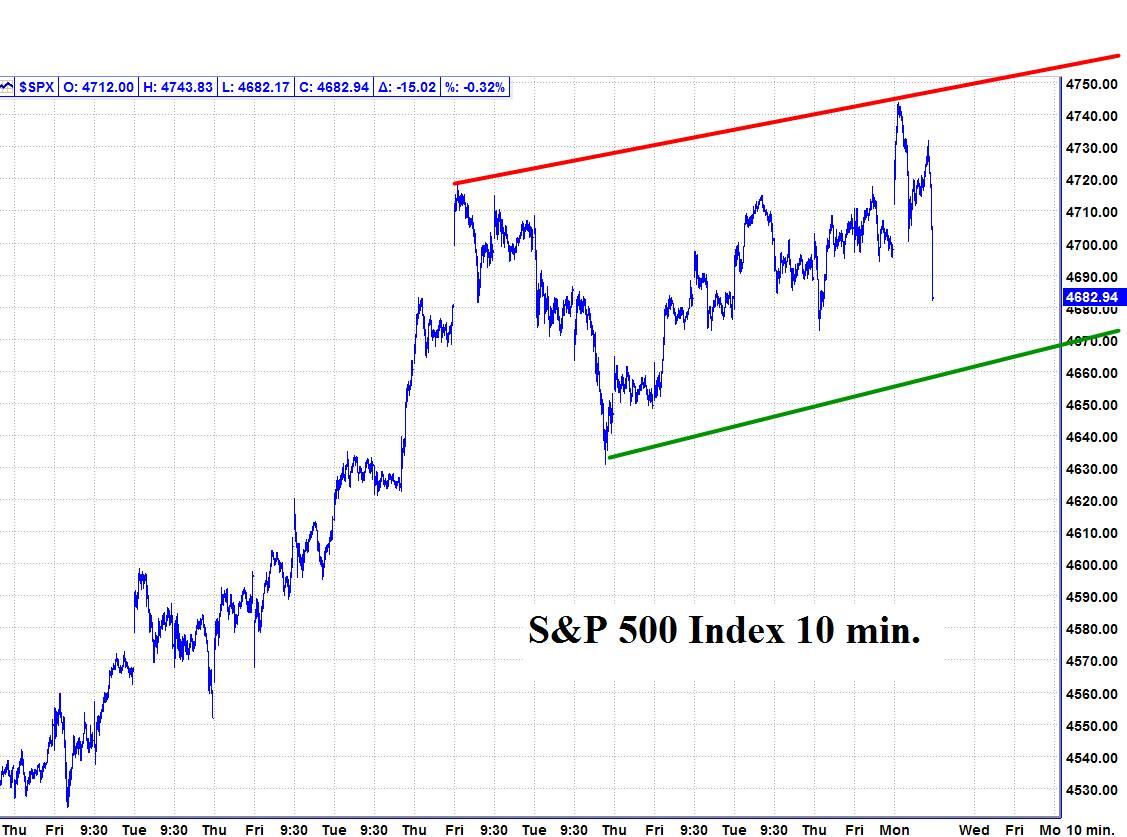
Please see below the S&P 500 10 minute chart.
Support - 4680, 4660 Resistance – 4745.
Please see below the S&P 500 Daily chart.
Support - 4680, 4660 Resistance – 4745.

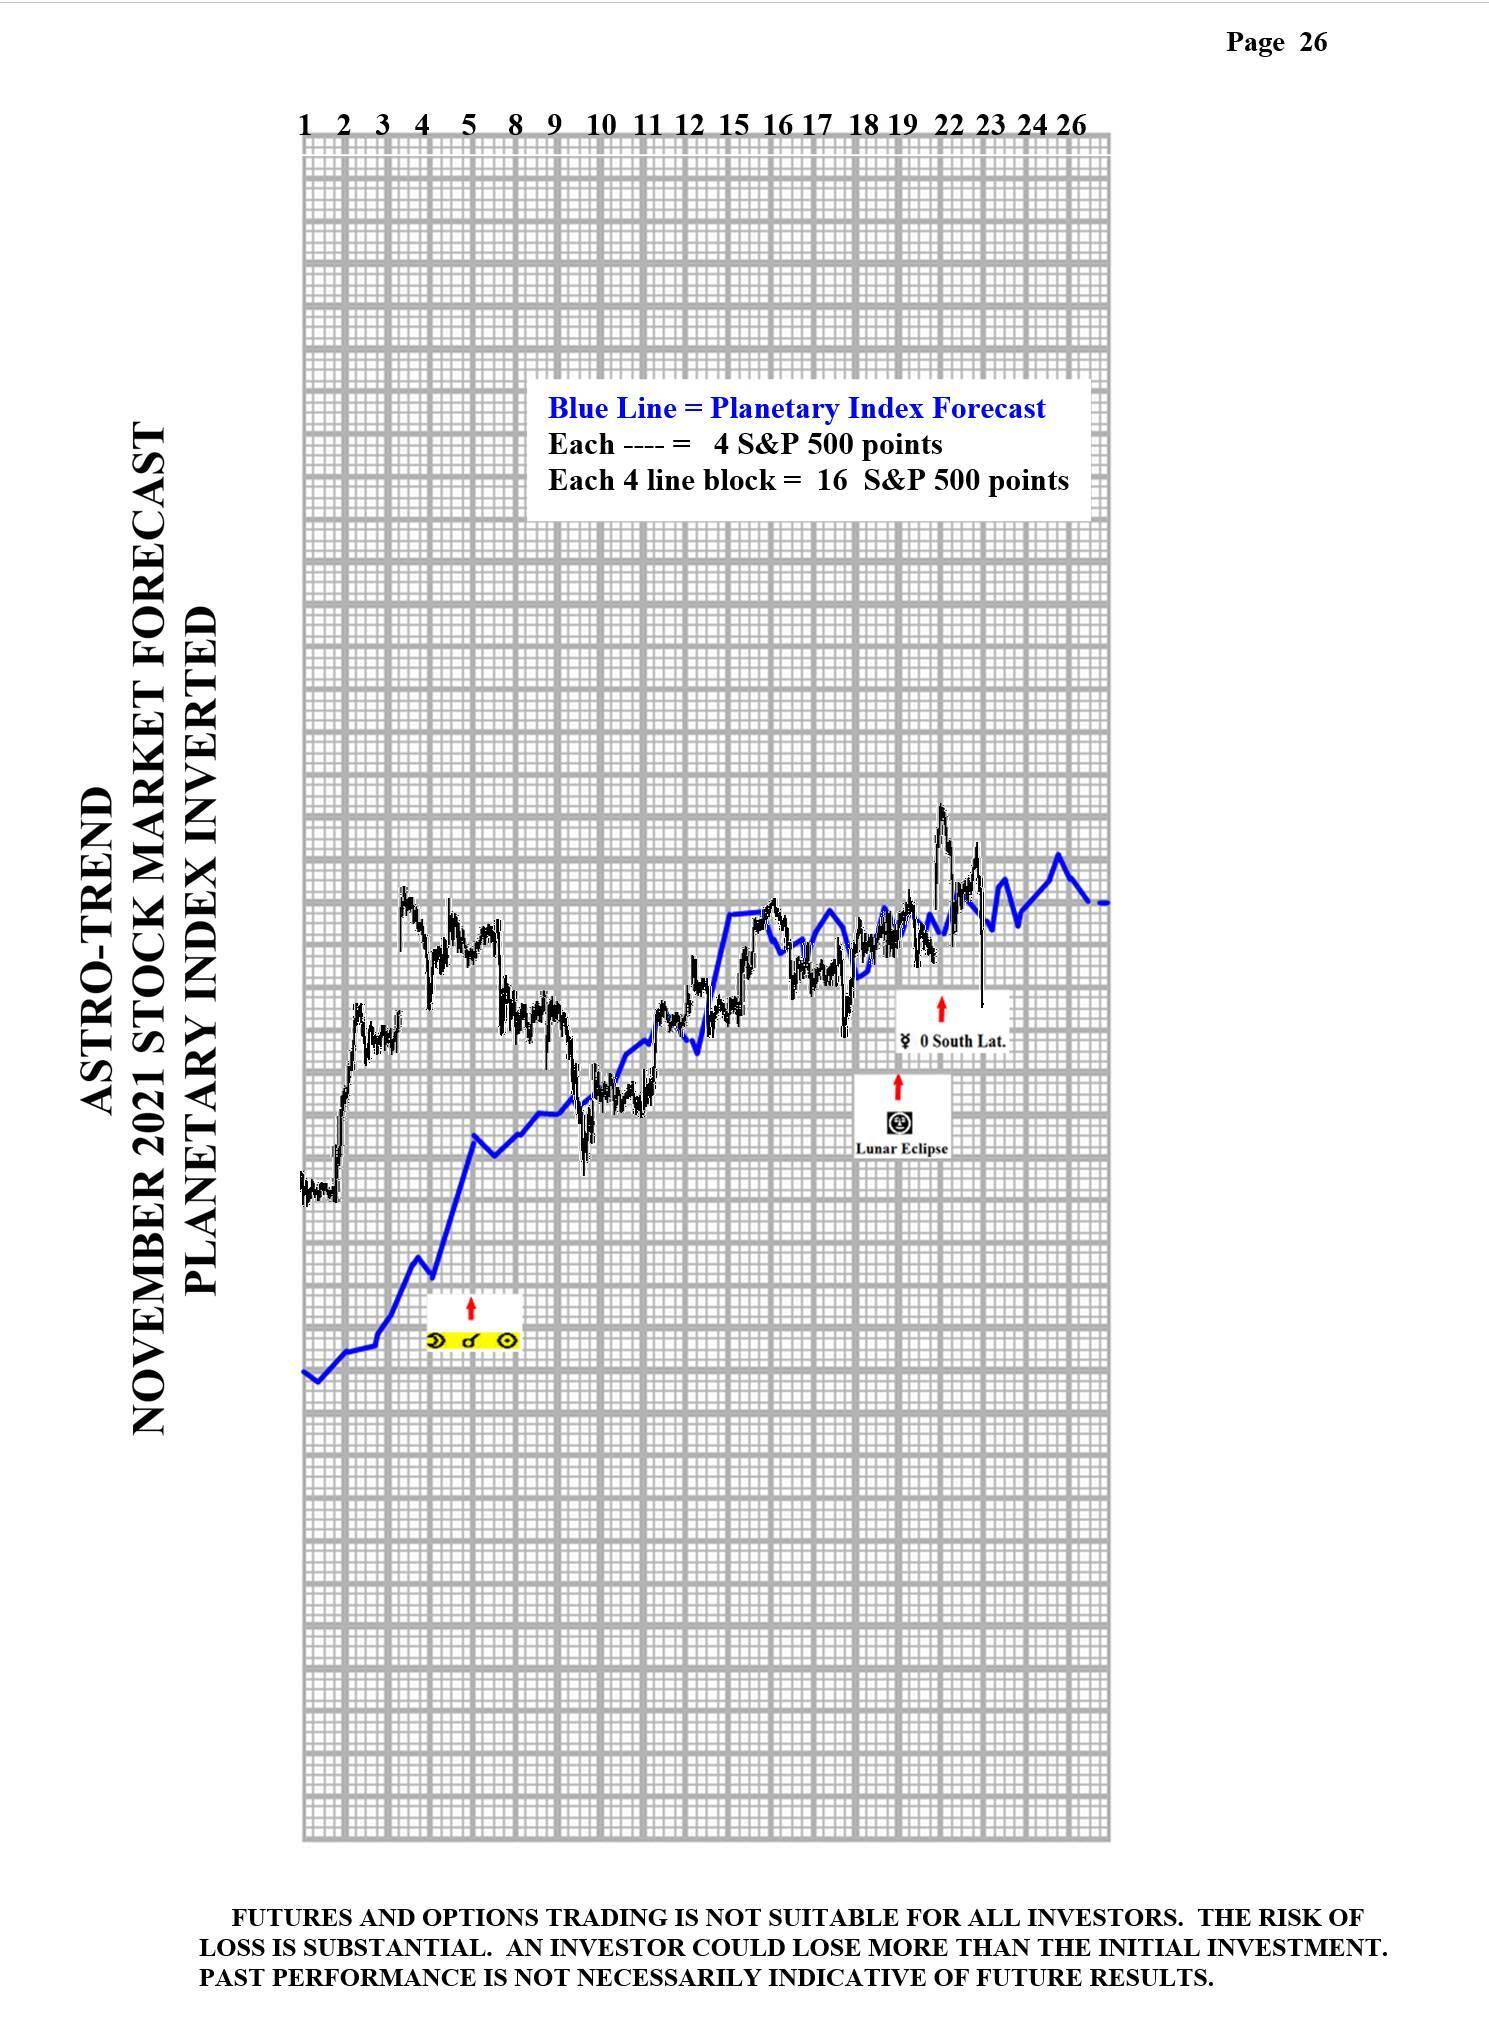
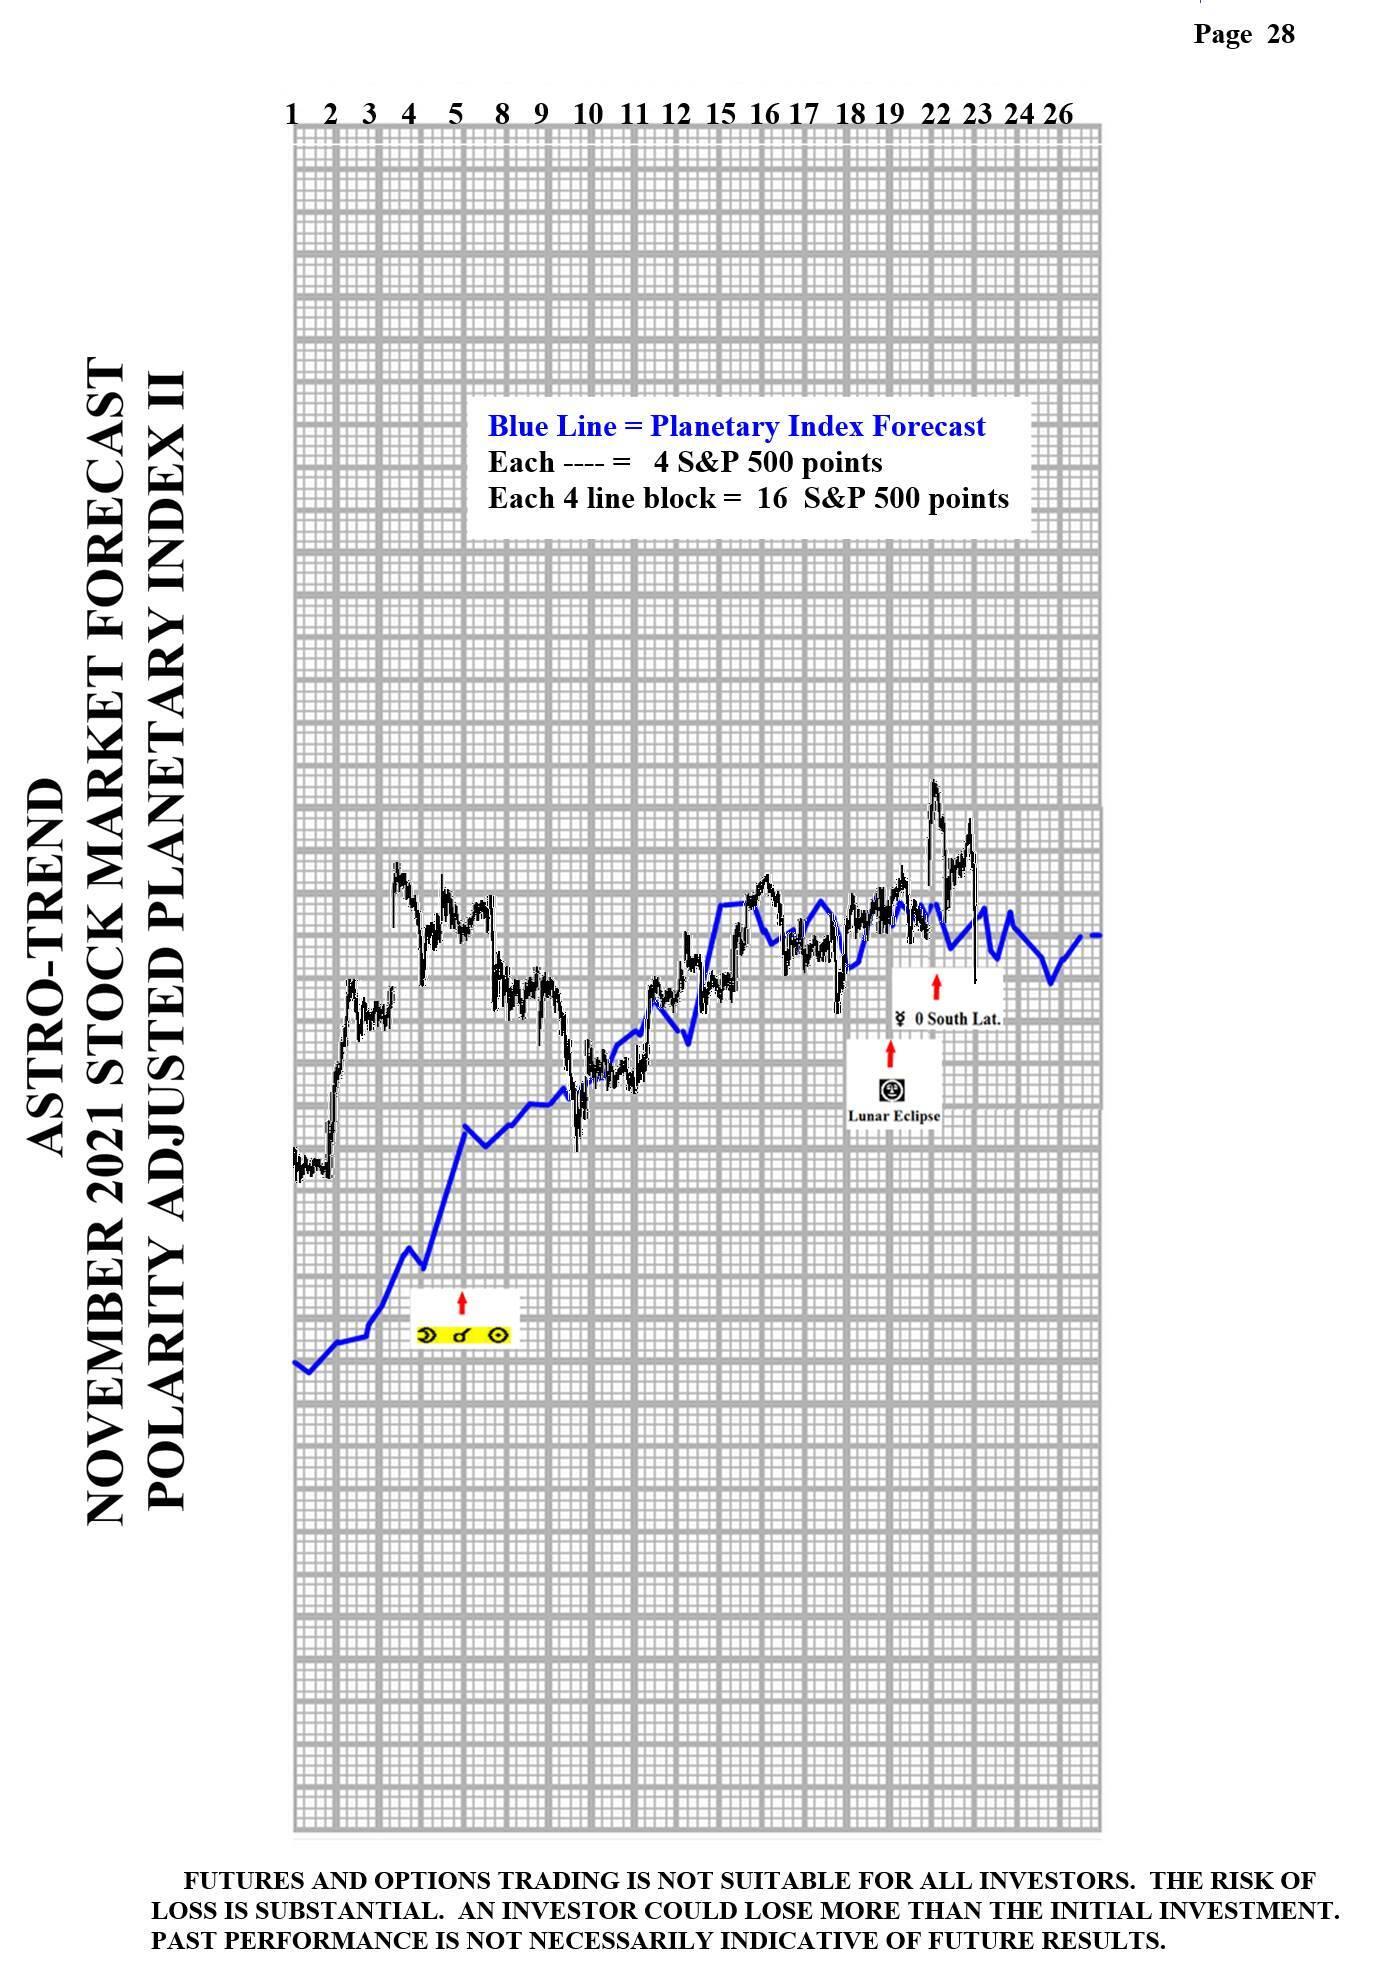
Please see below the Planetary Index charts with S&P 500 10 minute bars for results. As of November 22, I am dropping the charts from pages 25 and 27.
Author

Norm Winski
Independent Analyst
www.astro-trend.com


