The S&P 500 is near all-time highs, but only a quarter of its stocks are above their 50-day average. What does that mean?
- In early October less than a quarter of S&P 500 stocks were trading above their 50-day average.
- The index still produced new all-time highs earlier this week.
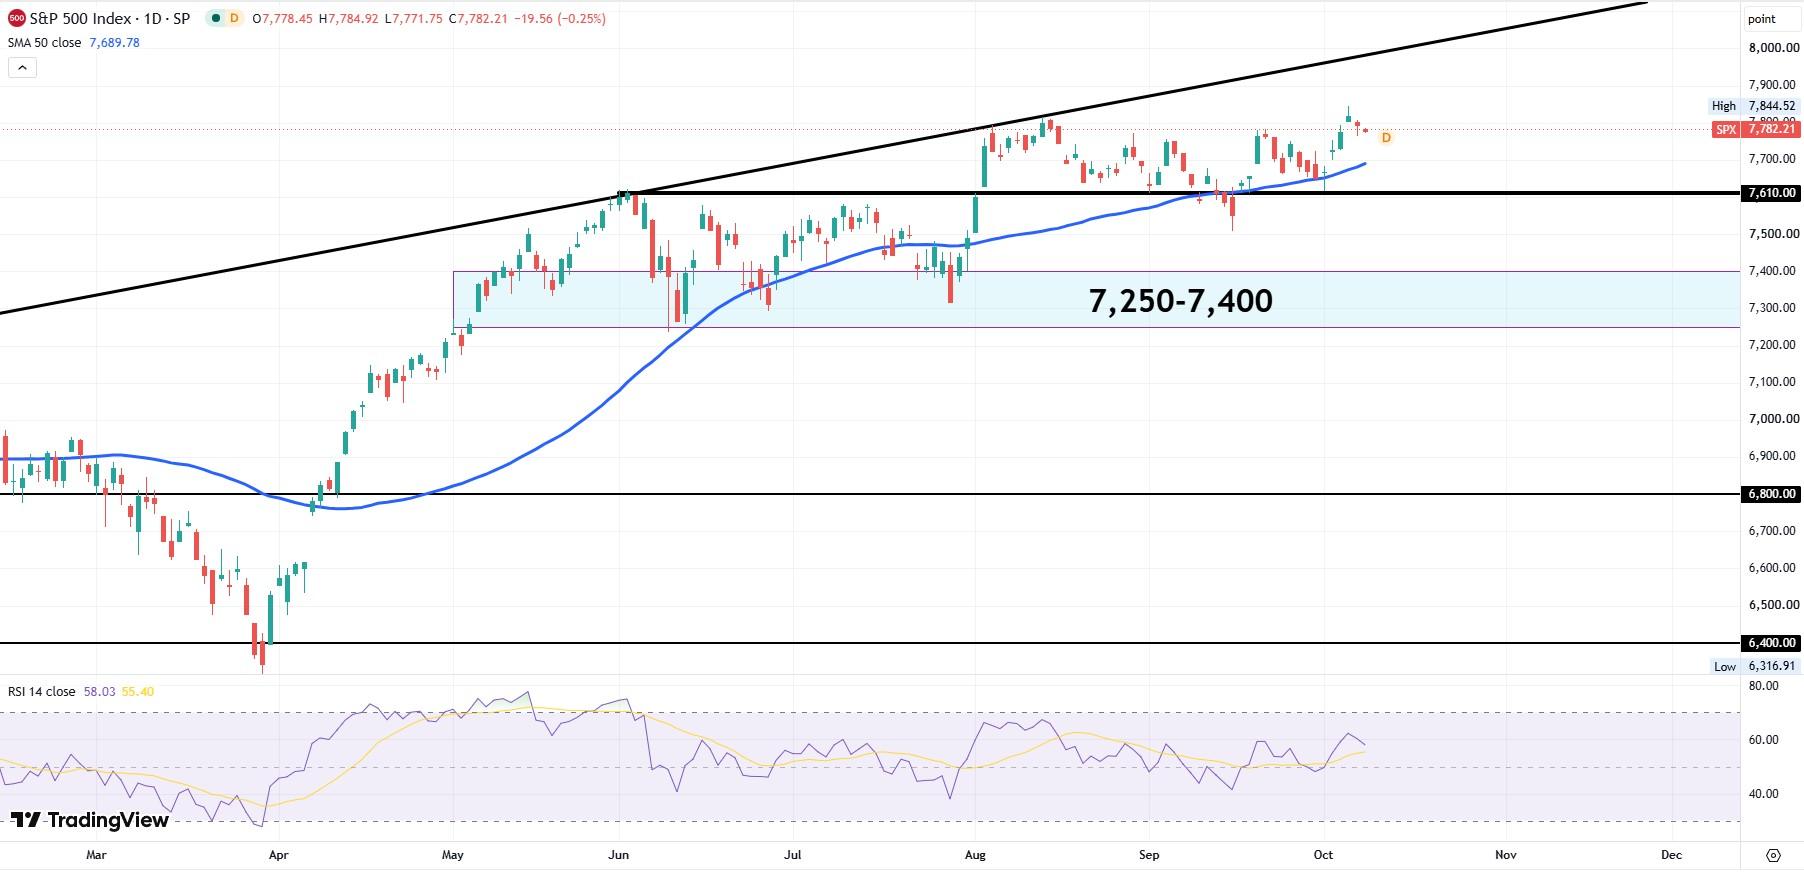
The S&P 500 is near all-time highs once again. On Tuesday, the most-watched index hit 7,844, surpassing the previous all-time high set on August 13, less than two months ago.
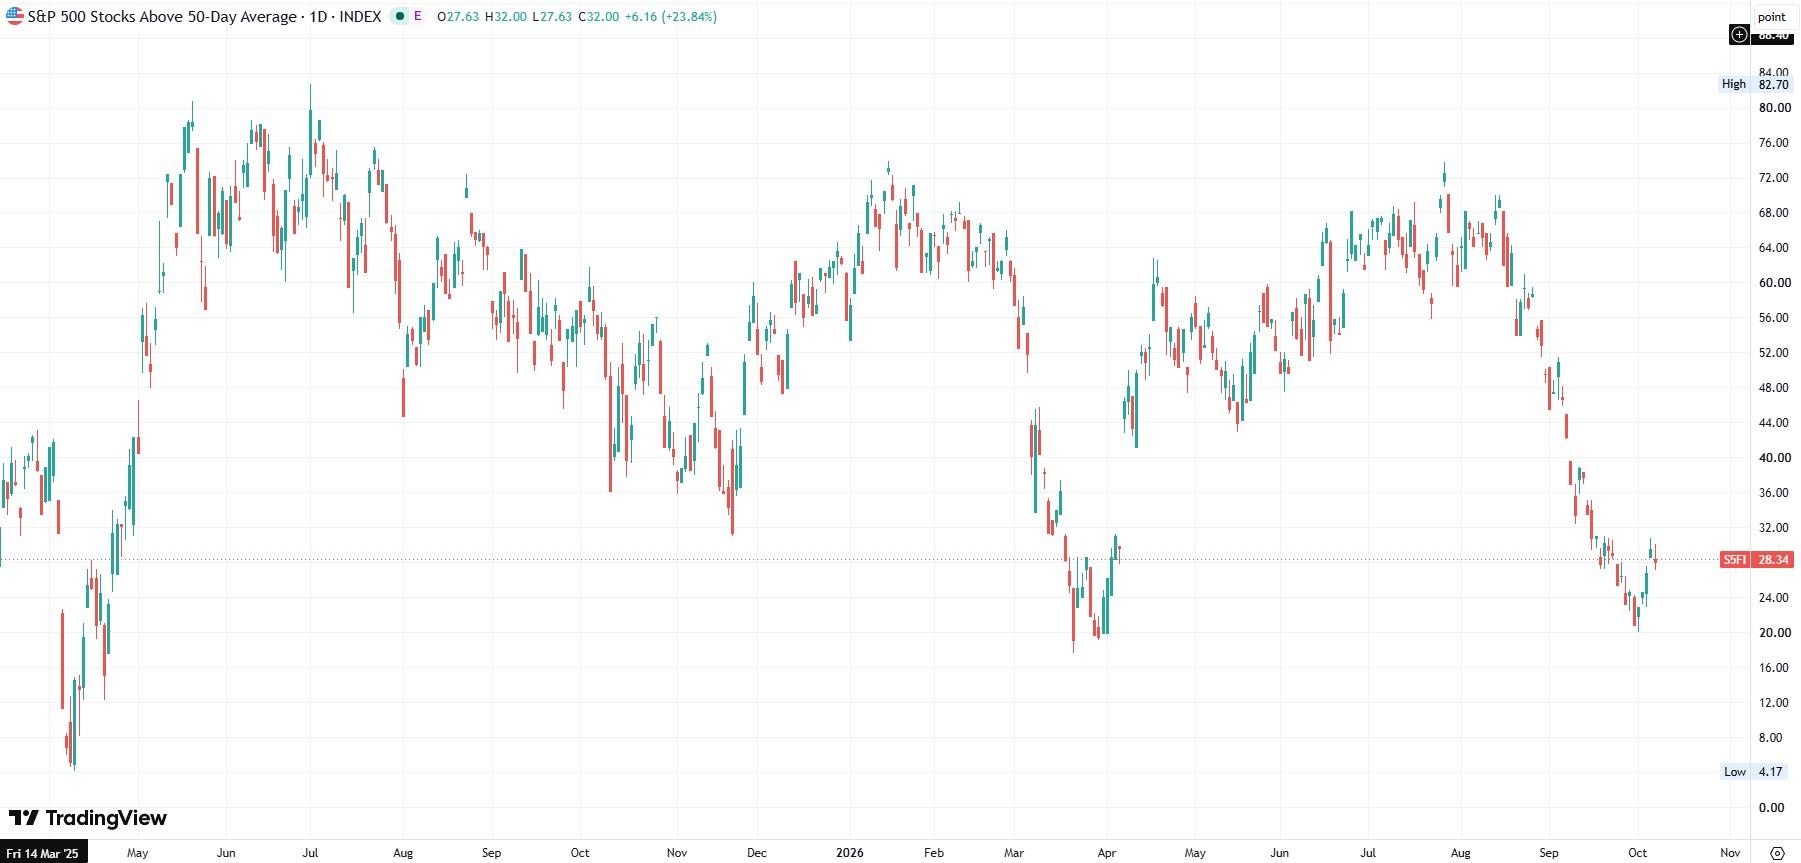
But what wasn’t immediately clear to investors just staring at a candlestick chart was that the market’s breadth had completely reversed from that prior period. Only about one-quarter of the S&P 500’s constituent stocks were above their 50-day Simple Moving Average (SMA) on Tuesday, whereas about 68% of the index was on August 13.
What does that mean? It means the market is sending a mixed message that investors often misinterpret. When people see the index pushing toward record levels, the instinct is to assume broad strength throughout its 500-odd members. But the reality is more complicated.
A market can rise even when most of its components are weakening, and that is exactly the kind of environment investors are facing in early October. Understanding why this happens and what it implies for future returns is essential for anyone trying to navigate a market that looks strong on the surface but is quietly losing momentum underneath.
The first thing to understand is how the S&P 500 behaves structurally. It is a market-cap-weighted index, which means the largest companies exert the most influence on its direction. When the biggest stocks are rising, the index can climb even if the majority of smaller names are struggling.
This dynamic has become more pronounced in recent years as mega cap tech and semiconductor companies have grown to represent an outsized share of the index. When these giants rally, the index rallies with it. When they pause, the index often stalls.
For instance, Nvidia (NVDA) and Apple (AAPL) now make up approximately 15% of the entire index, and the top 10 stocks place us close to 40% of the index. When we combine tech and communication services, this figure rises to 50% of the weighting, and when we pinpoint the 10% of S&P 500 stocks most exposed to the AI boom, our weighting grows closer to 60%. This concentration creates situations where the headline index looks healthy, while the average stock looks tired.
And much of the S&P 500’s blue chips sure do look tired. The chart below breaks down the equity market into its primary sectors, using State Street’s handy ETFs. Since the beginning of August, only the Technology (XLK) and Energy (XLE) SPDR ETFs have outperformed the S&P 500 mother index itself.
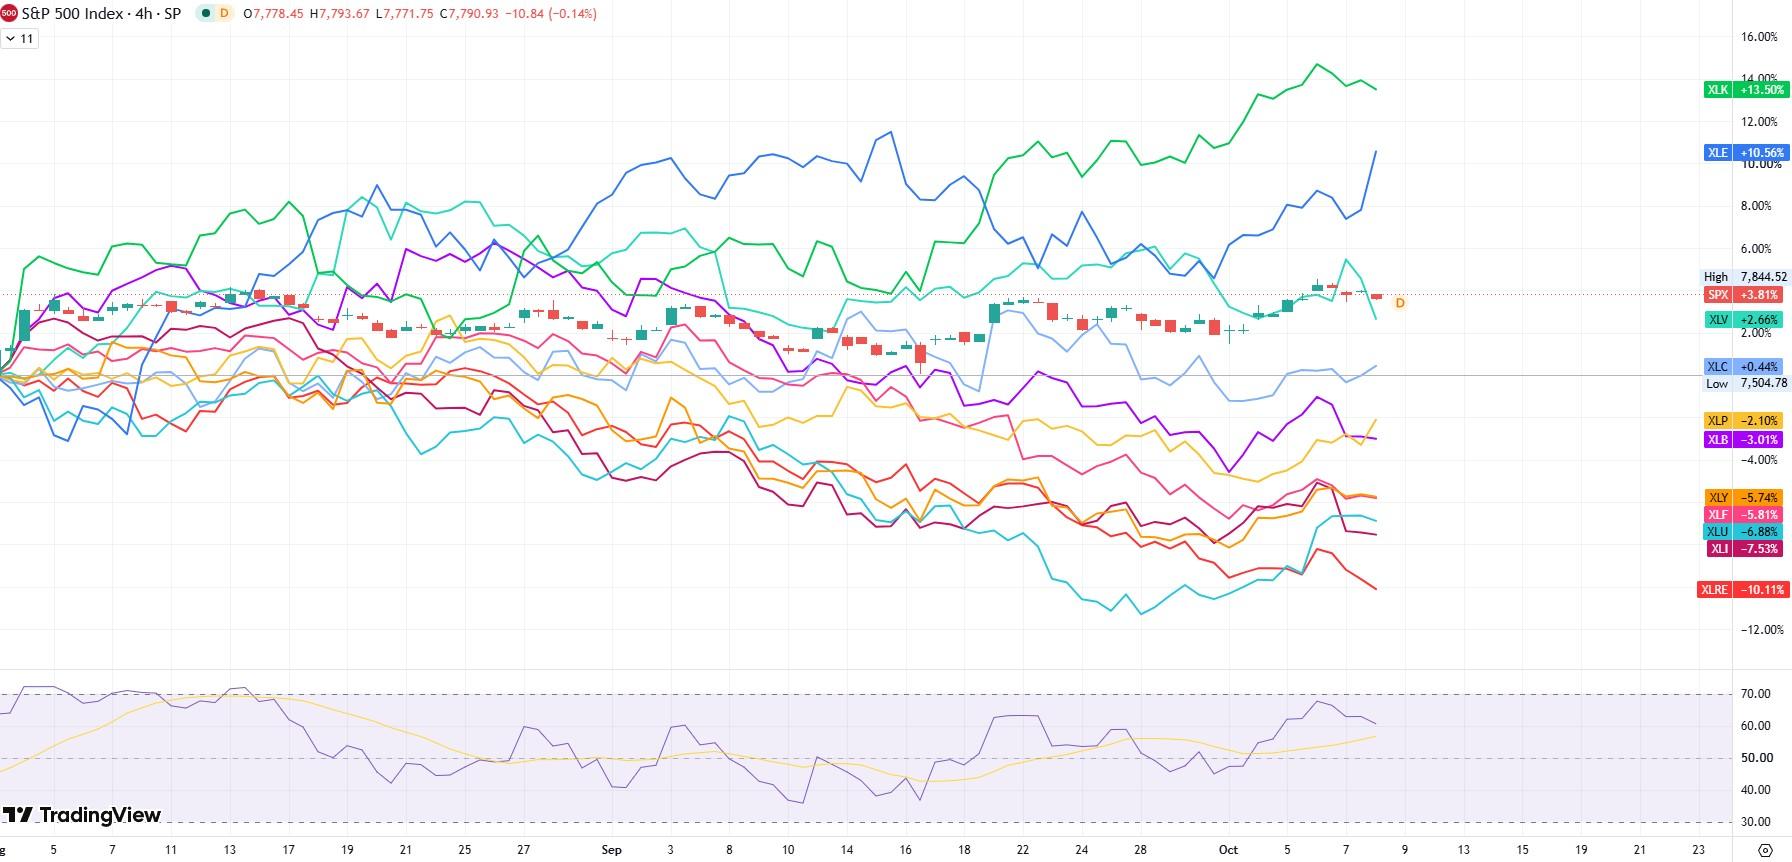
Of those 11 sector ETFs, seven sectors have gone negative since the start of August. These are the Consumer Staples (XLP), Materials (XLB), Consumer Discretionary (XLY), Financials (XLF), Utilities (XLU), Industrials (XLI) and Real Estate (XLRE) sector ETFs.
In a nutshell, the AI-boosted tech sector is holding up the entire market with a little help from energy, which is benefiting from the tight Oil market supplied by the US war with Iran.
The primary reason that breadth has fallen since August is that the market realized that the US central bank would be hiking interest rates mid-cycle. This placed upward pressure on US Treasury yields, which compete directly with many blue chip stocks that offer dividends, often at lower rates.
The fact that only one-quarter of S&P 500 stocks are above their 50-day SMA is a sign of weakening breadth. Breadth measures how many stocks are participating in a trend. Strong breadth means many stocks are rising together. Weak breadth means only a handful are doing the heavy lifting. Historically, markets with strong breadth tend to be more durable because leadership is broad. When only a small group of stocks carry the index, any mishap in that group can create outsized downside pressure.
Weak breadth near all-time highs is not unusual, however. It often appears late in an uptrend when investors crowd into the strongest names and ignore the rest. The result is a market that looks powerful at the top but hollow underneath. This does not guarantee an imminent correction, but it does increase the risk that the next bout of volatility will be sharper than investors expect.
This low-breadth environment raises questions about the sustainability of the AI boom. Multiple years of outperformance could require a long pullback as we saw in 2022. Markets can rise on narrow leadership for long periods, but they cannot rise indefinitely without broader participation. Eventually, either breadth improves or leadership falters.
So what does this mean for investors? It means they should pay attention to breadth as a risk indicator. When breadth is strong, pullbacks tend to be shallow because many stocks are participating in the trend. When breadth is weak, pullbacks can be more extreme because leadership is concentrated.
Somewhat counterintuitively, if the index is already being carried by a handful of mega cap stocks, investing directly in those stocks might be a better bet than investing in an index being held down by the vast majority of its constituents.
Of course, trimming S&P 500 index gains here and shifting some percentage into Treasuries could also be a key means of reducing concentration risk.
Finally, this environment suggests that opportunities may exist outside the leaders. When breadth is weak, lagging stocks often become oversold or undervalued. If economic conditions stabilize or improve, these cheaper stocks can recover sharply. Investors who focus only on the leaders may miss these opportunities.
In short, the S&P 500 being near all-time highs while only one-quarter of stocks trade above their 50-day average is a sign of weakening breadth. It reflects a market that is strong at the top but soft underneath. It does not guarantee a correction, but it does raise the stakes for the next shift in leadership. Investors who understand this dynamic can navigate the environment more effectively and avoid being misled by the headline index level.
Author

Clay Webster
FXStreet
Clay Webster grew up in the US outside Buffalo, New York and Lancaster, Pennsylvania. He began investing after college following the 2008 financial crisis.