The renewed SP 500 upswing is knocking on the door

As expected, the S&P 500 closed back above the mid-June highs resistance yesterday. The volume slightly rose but I wouldn't read too much into it – after all, the early June highs of around 3230 should provide for a bit stiffer battle. How the market reached the current 3160- ish levels, is what counts more.
And after the daily ride higher throughout the Independence Day week, we're experiencing a shallow sideways correction now. When we look in retrospect, will it remind us of bullish flag? In other words, can we expect the market to power higher and soon?
I think so. Higher stock prices are likely despite the high yield corporate bonds having lagged yesterday, or the investment grade corporate bonds suffering a rare daily decline. Market reaction to today's unemployment claims won't probably support the bulls to a great extent, yet I expect the push higher in stocks to continue.
In today's analysis, I'll cover the reasons why, and also discuss the non-confirmations that I would like to see resolved constructively.
I think the breakout will be confirmed shortly, and that the bulls will prevail in the clashing narratives and facts on the ground:
(...) I say so despite the uptrend in new U.S. Covid-19 cases that has many states stepping back from the reopening, rekindling lockdown speculations. I say so despite the Fed having its foot off the pedal in recent weeks, which makes for more players looking at the exit door as the rising put/call ratio shows.
The dollar is taking it on the chin, and emerging markets are seeing stellar gains, boding well for the U.S. markets. V-shaped recovery being real or not, corona vaccine hype or not, stocks love little things more than the central banks standing ready to act. And the punch bowl isn't about to be removed any time soon.
The only policy risk is a lockdown miscalculation – did you see how the ASX 200 Composite (take that as Australia's S&P 500) took to Victoria's 6-week lockdown institution? Thankfully for the U.S. economy, Larry Kudlow (speaking for Fox Business) is in no mood for a second nationwide lockdown.
Yes, corona cases are rising, but testing has risen too. What about deaths? As the below CDC chart seen on OffGuardian shows, any news of their spike would be an exaggeration, as Mark Twain would probably say.
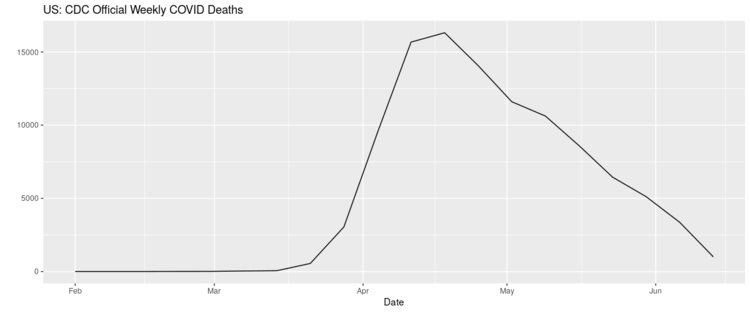
Food for thought and inquisitive minds. Sticking with the markets, let's check upon yesterday's S&P 500 performance.
SP 500 in the Short-Run
I'll start with the daily chart perspective:
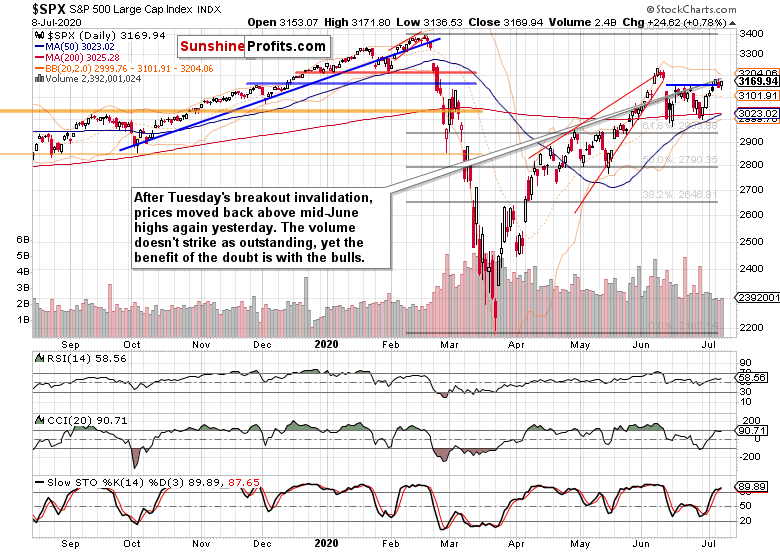
On Wednesday, prices rose back above the horizontal line connecting mid-June tops, on a not so extraordinary volume. But is that a necessarily bearish omen? I don't think so – the swing structure gives the bulls the benefit of the doubt. Please note that in the latter half of May (when stocks were peeking above the late April highs), the volume on those days wasn't outstanding either.
Such were my yesterday's thoughts as to the daily indicators:
(...) Both the CCI and Stochastics keep supporting the upside move – it's only the RSI that feels tired. This doesn't concern me that much – it's not flashing a bearish divergence, it isn't languishing at an extreme reading. In short, it doesn't preclude the rally from going on once the current breather is over.
And until I see credible signs that the markets are getting spooked by corona, botched policy responses or anything else, there is little point in acting as if the sky is falling. It isn't the case – to be clear, the time to turn really bearish would come, but we're not there yet.
Whenever markets start acting jittery, it pays to remember the big picture:
(...) Recapping the obvious, stocks are on the upswing after the bears just couldn't break below the 200-day moving average, which means that the momentum is with the bulls now. The daily indicators keep supporting the unfolding upswing, and volume doesn't raise red flags either.
Let's check the credit markets' message next.
The Credit Markets' Point of View
Yes, high yield corporate bonds (HYG ETF) scored an upswing yesterday, but are still trading below Monday's closing prices. Please visit this free article on my home site so as to see more of the discussed charts. To justify turning more bullish on stocks, renewed animal spirits in the junk corporate bonds arena would be needed.
And not only in junk corporate bonds – it's that the investment grade ones (LQD ETF) have wavered yesterday. But similarly to the HYG ETF move, the volume in LQD ETF hasn't been remarkable, which is why I am not jumping to conclusions (and definitely not bearish ones) just yet.
The respective ratios (HYG:SHY and LQD:IEI) mirror that short-term indecisiveness perfectly. A daily increase in one, and a daily decline in the other. The overreaching dynamic is though one of an uptrend, which is why I look for the daily non-confirmation to be resolved with an upside move.
Encouragingly, the ratio of high yield corporate bonds to all corporate bonds (PHB:$DJCB) has turned higher yesterday. That's a gentle nod in favor of the HYG:SHY ratio's upswing.
As said, I don't see a proof that the sky is falling – should I see one, I'll change my mind and let you know about it. With the Fed waiting in the wings, the path of least resistance remains higher. And don't forget about the infrastructure bill or the second stimulus check either.
If you look at the HYG:SHY chart with the overlaid S&P 500 closing prices, you'll see that stocks didn't really get more extended than they were since the late June bottom. While this condition might not last all too long into the future, I don't expect stocks to be brought immediately down courtesy of this factor alone.
From the Readers' Mailbag
Q: Although SPX and NDX keep rallying as you predicted, RUT is not participating much and most of the stocks other than major stocks are not rising with the index. Does that concern you? When do you think RUT will participate in the rally in significant way? Does it have to wait until COVID second wave is resolved in some way or after the second quarter reports are out?
A: Thank you, technology (XLK ETF) has indeed reached new 2020 highs yesterday, and it's leading the index higher. In a sign of confirmation, semiconductors are also challenging their early June highs.
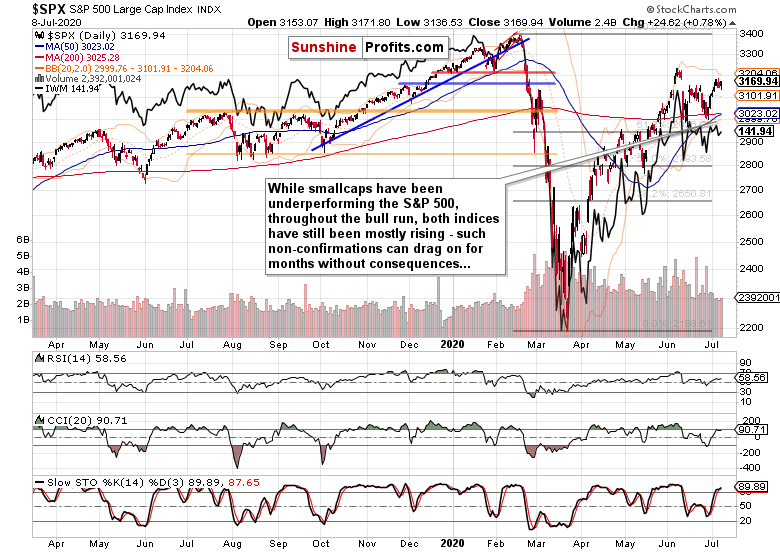
Russell 2000 (IWM ETF) has been indeed underperforming since the March 23 bottom. But the caption says it all – both indices have been climbing higher nonetheless. Of course, the S&P 500 outlook would be more bullish if e.g. IWM ETF traded also above its 200-day moving average.
Given the unfolding S&P 500 upleg and recovering risk appetite (see e.g. the PHB:$DJCB ratio, or the room for growth in XLF:XLU and XLY:XLP), I think it's a question of time when Russell 2000 breaks above its 200-day average too. But this isn't strictly about the underperformance for any S&P 500 investor to get spooked by. I would focus on whether I see signs of distribution in the IWM ETF. There are none currently.
If I saw IWM ETF weakening while the individual stock heavyweights in the S&P 500 went higher still, that would be concerning. That's because once the smallcaps roll over to the downside, the S&P 500 would follow eventually as the generals wouldn't just prop it up indefinitely. And this isn't happening.
I think the Covid-19 second wave fear is a distraction – smallcaps can rise regardless. Any policy missteps would be more concerning for small- and medium-sized businesses. The same goes for the Q2 earnings and the usual games around bringing down previously upbeat expectation in order to have a better chance to exceed them. In other words, it's the P that counts for more in the P/E ratio.
Summary
Summing up, Tuesday's decline in the S&P 500 was indeed merely of short-term nature, and the credit markets tentatively support the stock upswing to go on. Market breadth isn't at daily extreme readings, emerging stocks are outperforming, and the dollar isn't an obstacle to further stock gains. I look for the breakout above short-term resistance formed by the mid- June tops to succeed shortly as the rally's internals including technology, semiconductors and risk-on metrics are improving.
Want free follow-ups to the above article and details not available to 99%+ investors? Sign up to our free newsletter today!
Want free follow-ups to the above article and details not available to 99%+ investors? Sign up to our free newsletter today!
Author

Monica Kingsley
Monicakingsley
Monica Kingsley is a trader and financial analyst serving countless investors and traders since Feb 2020.


