The on-going sector rotation from growth to value stocks [Video]
![The on-going sector rotation from growth to value stocks [Video]](https://editorial.fxstreet.com/images/Strategy/TrendFollowing/following-the-trend-indicator-gm452676099-30003628_XtraLarge.jpg)
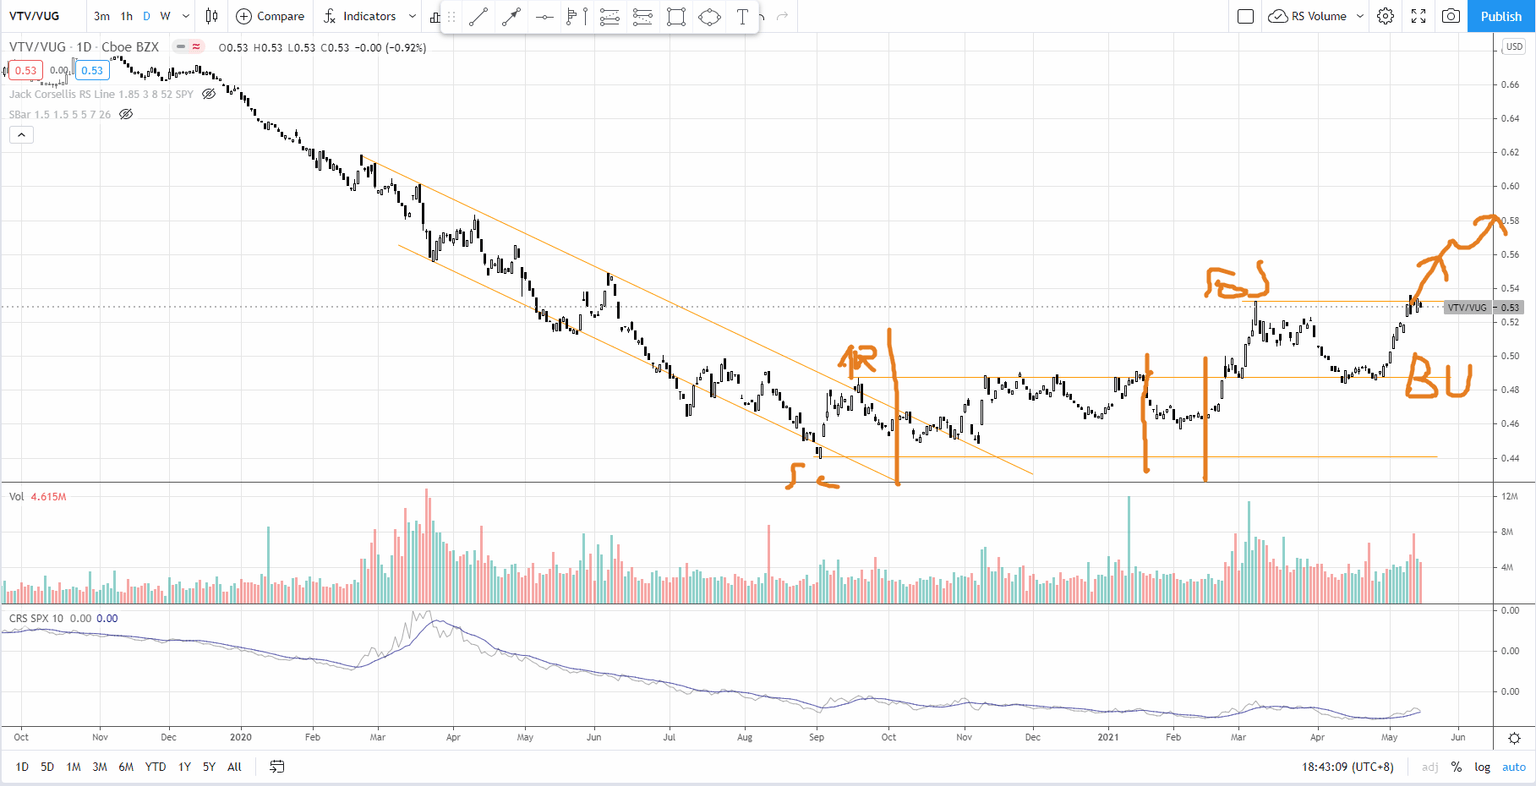
There is an ongoing sector rotation from growth to value started since Sep 2020. Refer to the chart of VTV/VUG below
What're VTV and VUG?
VTV is the Vanguard value ETF and VUG is the Vanguard Growth ETF. You can view them as proxies to value and growth stocks.
What does the ratio chart mean?
Based on the down channel, value stocks have been lagging the growth stocks until Sep 2020 where there was a Change of Character stopping the downtrend into a trading range.
So Sep 2020 marks the start of the sector rotation. It was not obvious back then because majority of the growth stocks are still leading.
The sector rotation become obvious since mid of Feb 2021 while the above ratio chart showed a Wyckoff sign of strength rally breakout and that is when we witness more growth stocks were beaten down.
At the moment, it seems like the ratio chart is about to breakout to start the markup phase, which complete the accumulation structure. This means that value stocks will lead the growth stocks and perform a lot better (like what the growth stocks did after COVID sell off back in 2020).
If you go back to check the tech sector (which represents growth stocks), you will find that there are more groups get beaten down (even semiconductor was down despite the catalyst of shortage of semiconductors) since Feb 2021.
So, avoid the growth stocks (tech) for the time being else you will need to be extremely agile to trade the rebound or be very selective for individual stocks.
What to focus?
Meanwhile, more and more value stocks are showing strength nice uptrend. The trend is your friend. Stick to these nice trending value stocks. Check out the video below to find out how you can participate the strong trend of these 3 value stocks.
Author

Ming Jong Tey
Independent Analyst
Ming Jong Tey has been trading since 2008. He started his learning journey from technical analysis (indicators, Fibonacci, etc...) to value investing. Throughout his journey, he develops an interest in price action with chart pattern trading.


