The next big Cryptocurrency analysis by market cap and trend
The Crypto-Sphere Plunge
If you have been following the crypto market recently you have probably heard the term “blood-bath”, and that the end of Cryptocurrencies is a foregone conclusion. The rumors of the demise of cryptocurrencies have been greatly exaggerated. Even with all the recent negative news surrounding them; I think now is the time more than ever to begin searching for entry opportunities into the cryptocurrency market.
Undoubtedly, a single glance at the top 15 cryptocurrencies and obvious realignments is visible. BitcoinGold is off the top 10 list at #15 after an excess of $2B of market cap was clipped between January 13 when it stood at $5.3B and January 16 when it was at $3.2B.
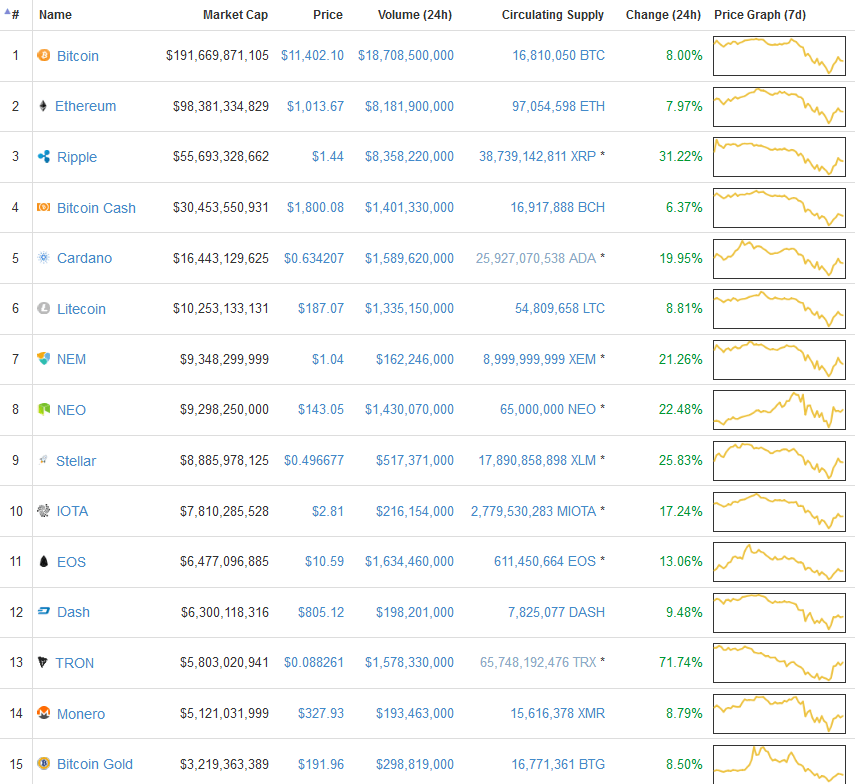
Figure 1: Top 15 Coins (Source: coinmarketcap)
Evidently, the general altcoin plunge begun late on January 15, 2018 and most coins have recorded double-digit declines with LTC, in particular, losing more than 50% of its value. As a result, its market share dropped to 1.86% complemented by market cap of $10.2B.
Of note though was the slide in Bitcoin prices and the inevitable Domino effect. It was a reminiscent of Chinese ban of Bitcoin payment back in 2013 when prices slumped by more than 40%.
As it is, Bitcoin is trading at around $11,500 but on January 16, its price had sunk below the psychological $10,000 mark giving it a market cap of around $180B. The same bear moves affected Ethereum valuation. The platform market value depreciated by more than 25% when its market capitalization dropped $125B to $98B over a 2 day period starting from January 15.
Bitcoin market capitalization dropped to $190B and that’s about 35% of the crypto-currency market cap standing at $570B (as I type this). However, it is still a far cry from January 13 cap when it printed $241B. A reprieve though and perhaps a reason for crypto-enthusiast to smile in this mild bear run is that the total coin market capitalization surpasses that of Berkshire Hathaway Inc. and Facebook stagnant at $528B and $509B respectively.
It’s a relief but overly, more than $250B was eroded during this brief correction with noteworthy losses printed in Ripple, ticker XRP whose market cap now stands at $56B, down from $78B but an improvement from $46B printed on January 16. IOTA seems to be following a similar script with the facilitator of the Machine Economy and Internet of Things shedding more than $4B before finding support at $7B on January 15.
Reasons to Track IOTA
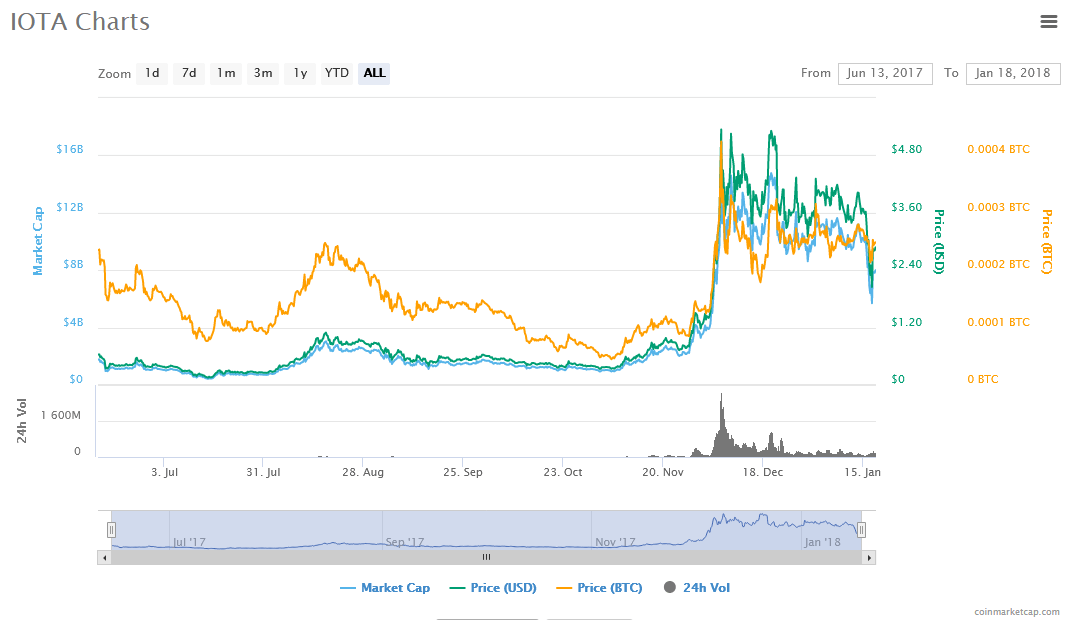
Figure 2: IOTA chart (Source: coinmarketcap)
Despite this slide caused partly by dropping trading volumes levels in Japan and South Korea, I expect IOTA to spearhead the expected altcoin recovery. Like everything else, its value-not price, lies on the product and we head towards a world of interconnected devices, IOTA will surely be the facilitator. With a respectable market cap of around $8B and a market share of 1.42%, I see possibilities.
When prices peaked at around $5.56 on December 20, 2017, its market cap stood at $14.2B and a market share of 2.28% which it turned booked it at place in the top 5 spot based on trading volumes. IOTA currently trades at $2.81-as I type this-and though respectable, it’s 45% down from $5.56. Because of this, many experience experts and traders think most coins are now fairly priced and ripe for a snap back to trend.
Extending findings from historical prices, it won’t be long before irrational exuberance sets in and drive the whole coin market close to January 7, 2018 market capitalization of $829.2B or even to the $1T mark. If it does that the whole coin market valuation will surpass that of Apple, the most capitalized corporation in the world, at $922B.In my opinion, it’s not an impossibility because we can readily borrow some few lesson from the 2017-2018 BTC and Ripple (XRP) spikes.
What We Can Learn From Bitcoin Supper Rally
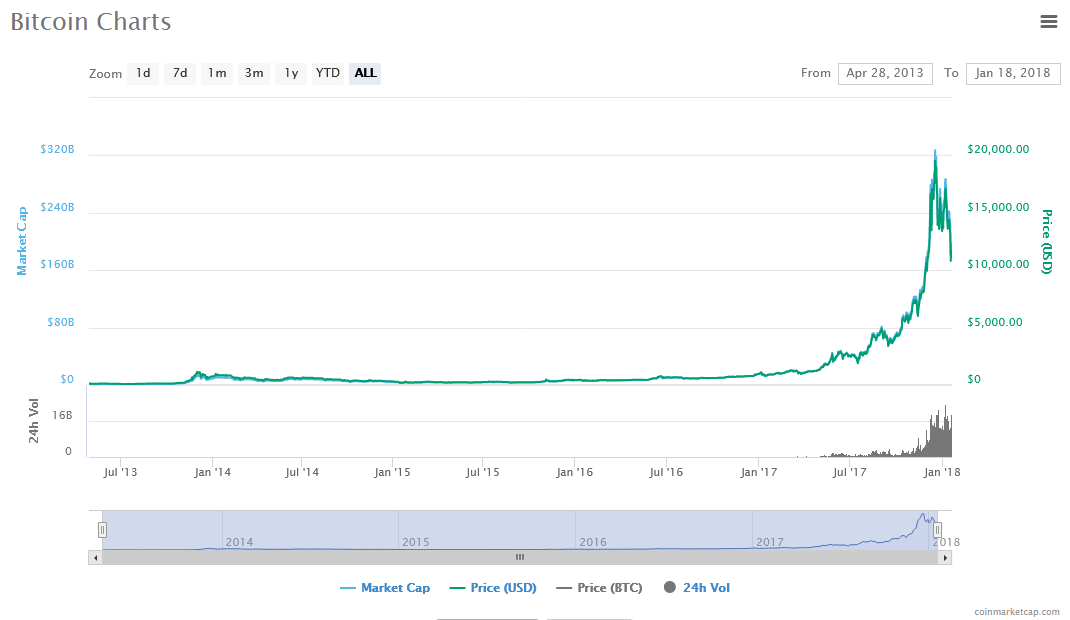
Figure 3: Bitcoin chart (Source: coinmarketcap)
Like most coins, there is a deflation element associated with BTC and we can blame it on Satoshi, he was obviously not an economist.
There will be 21M BTC to ever circulate, 4M of those are already lost and more than 80% of the total supply has been mined. The technology and product behind BTC brings it value and that value is reflected in price driven by supply-demand dynamics.
Data released from CoinBase and Bitstamp show that their user base kept increasing by 100K a day from around October 2017 and the effect was immediate. Bitcoin’s valuation and price trends continued climbing from a market capitalization of $71.2B on October 1, 2017 and peaking at about $320.8B on December 20, 2017.
During this time, it shook off government censures, technical issues-Segwit 2X and FUD meaning there was more than eye could see.
It’s all about value. It’s slippery and evasive. Venture capitalists, smart investors and government are always searching for it. Chinese saw potential in Bitcoin back in 2011, pumped it 1000% from $0.001 to $1 and $10,000 later, there are talks of BTC testing $1M.
…And Ripple Boom
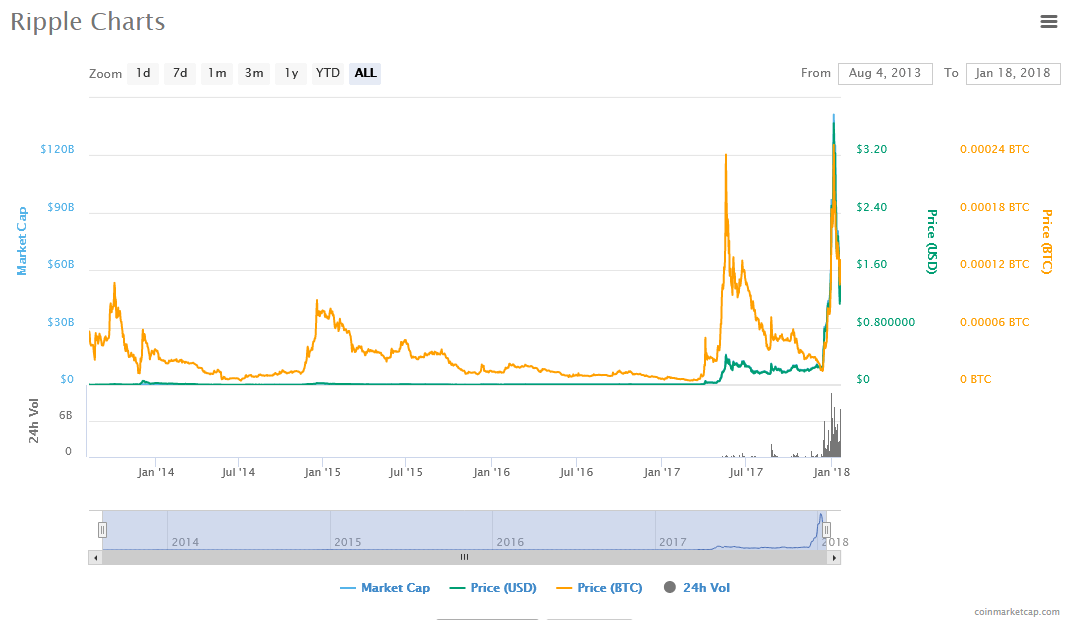
Figure 4: Ripple Chart (Source: coinmarketcap)
We can flip sense the other way and Ripple can demonstrate that. It’s a cross-border payment system marketed designed for global banks.
More than 100 banks have bought the idea but the real issue here safe the little bit of coin centralization by Ripple the company is the value proposition. The solution it seeks to bring to the global payment arena and we already have banks testing the system. This gives it credibility making it easy for investors to trust it.
In Q2 2017, XRP was available at $0.03 with a market cap of around $9B. Fast forward 10 months later and it is the 3rd largest cryptocurrency with a $58B market cap with each coin trading at $1.5 representing a 4900% rise in value which quickly outpace that of Bitcoin and Ethereum over the same period. XRP offer speed and all transactions are settled within 4 seconds.
From these two scenarios, any coin that solves real-life problems derive value and it doesn’t matter the price. There will be a boom as supply-demand creep in and after all, isn’t market capitalization a measure of what investors think of value?
Author

Kevin Dixon
Market Traders Institute, Inc. (MTI)
Kevin Dixon is one of Market Traders Institute’s expert stock and options analysts and has been in the trading industry for more than 30 years.


