The New Zealand Dollar sits near a one-year low after six straight weekly losses. This chart shows the key support that could decide what comes next

The New Zealand Dollar (NZD) is approaching a potentially decisive moment after six consecutive weeks of losses against the US Dollar (USD). NZD/USD reached 0.5580 on Monday, its lowest level since November 2025, bringing the pair back to the upper boundary of a broad 0.5580-0.5470 support zone that has repeatedly halted major declines since 2020.
NZD/USD has tested the region several times over the past six years, with buyers stepping in on each occasion and triggering significant recoveries. But there is an important warning: those rebounds have progressively lost strength. At the same time, both the 100-week and 200-week Simple Moving Averages (SMA) are declining, reinforcing the broader bearish structure.
The question facing traders is therefore whether historical support can once again attract enough demand to trigger a meaningful recovery, or whether six weeks of persistent selling pressure are setting the stage for a longer-term breakdown.
Six weeks of losses bring NZD/USD back to a support zone that has held since 2020
The 0.5580-0.5470 region has played a central role in the NZD/USD long-term price structure. The pair initially rebounded strongly from this area in 2020, eventually climbing above 0.7400 in early 2021. Subsequent tests of the zone also attracted buyers, including during the sharp decline in 2022 and again around the turn of 2024-2025.
However, the long-term chart reveals a gradual deterioration in the strength of those recoveries. After the 2021 peak above 0.7400, subsequent rallies stalled at progressively lower levels. NZD/USD failed to recover much beyond the mid-0.6500 area in 2022, struggled around 0.6400 in 2023 and 2024, and has been unable to sustain moves much above 0.6100 more recently.
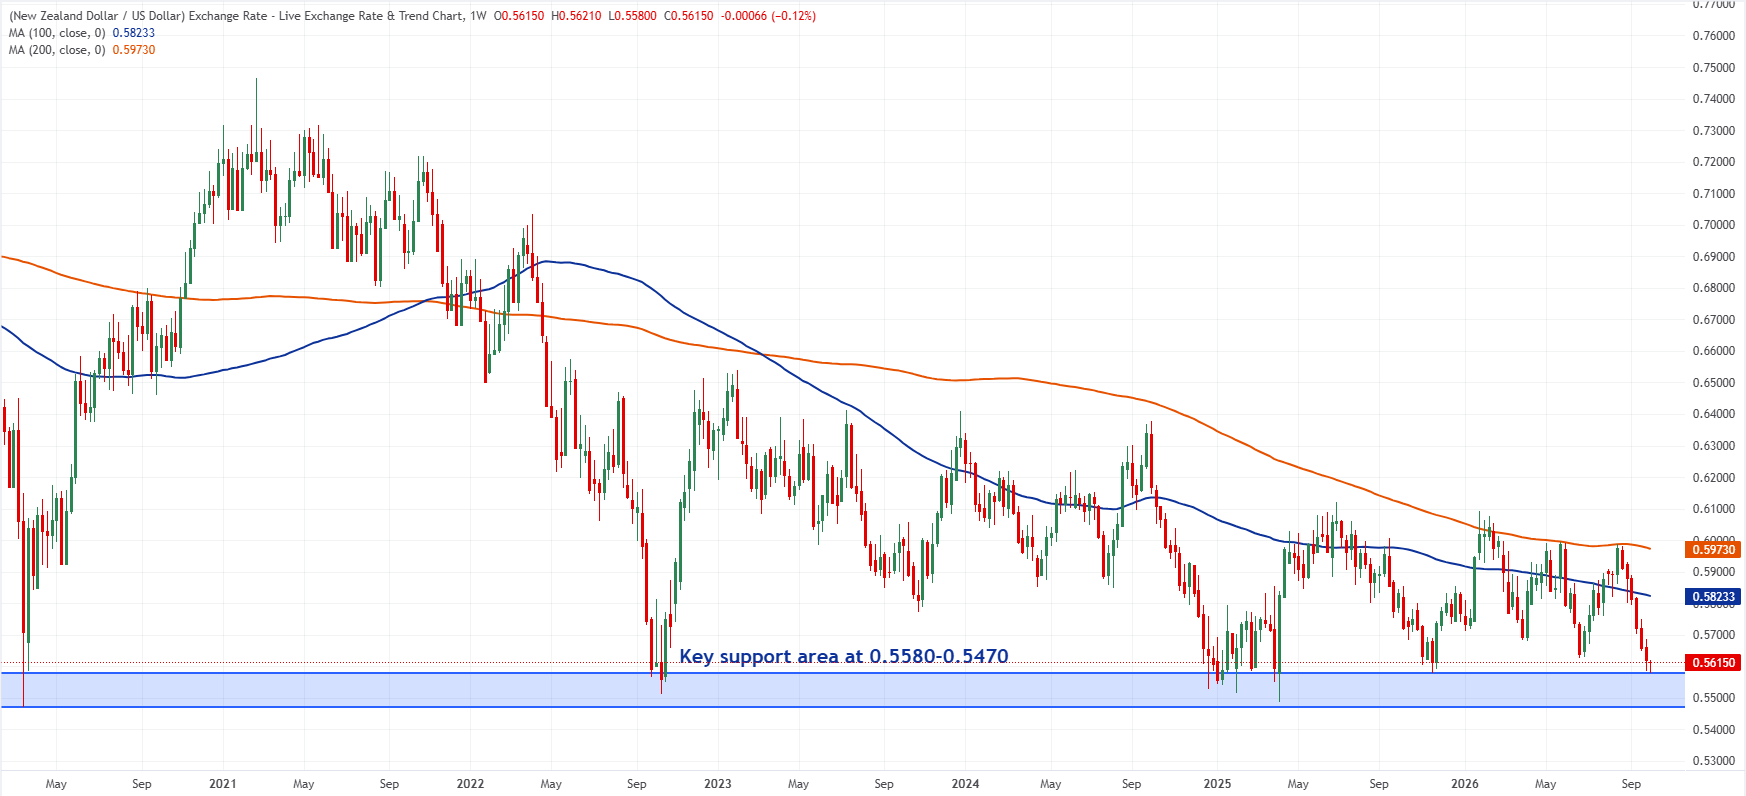
This sequence of lower recovery highs means the same support zone is absorbing bearish pressure while upside momentum progressively weakens.
The long-term moving averages tell a similar story. NZD/USD trades below both the 100-week SMA, currently around 0.5823, and the 200-week SMA near 0.5973. Both averages are pointing lower, underscoring a broader bearish trend despite the resilience of the 0.5580-0.5470 floor.
That makes the current test different from simply revisiting a familiar support. The longer the sequence of lower highs persists, the greater the importance of buyers demonstrating that they can still defend the area.
What happens if the support holds?
A successful defense of 0.5580-0.5470 could provide the foundation for another recovery, particularly after the speed of the recent decline. The pair has fallen for six consecutive weeks, and shorter-term momentum indicators have already reached oversold territory. While oversold conditions alone do not signal a reversal, they could amplify a rebound if buyers begin returning around the long-term support zone.
The first major upside test would come around the psychological 0.6000 level. This region is particularly relevant because the declining 200-week SMA is currently approaching 0.5973, creating an additional technical barrier just below the round figure.
A sustained recovery above 0.6000 would shift attention toward the 0.6100 region, around the peaks recorded in January and June 2025. Breaking those highs would be more significant for the long-term structure, as it would begin to challenge the pattern of progressively weaker recoveries visible since 2021.
For now, however, a rebound from support would not by itself reverse the broader bearish trend. NZD/USD would still need to reclaim several layers of long-term resistance before suggesting that the multi-year structure has materially changed.
A break below 0.5470 would open a very different scenario
The downside scenario carries potentially larger long-term implications. A sustained break below the lower boundary of the 0.5580-0.5470 support zone would remove a floor that has contained NZD/USD declines on several occasions since 2020. With limited recent price structure immediately below that region, traders could then have to look much further back for significant reference levels.
The next major area would emerge around 0.5200, near the lows recorded during the 2008 global financial crisis. Below there, the 0.5000 psychological threshold would come into focus, followed by the 0.5000-0.4900 region associated with the 2009 lows.
Such targets remain distant from current prices and would require a confirmed breakdown rather than a temporary move below 0.5580. Still, the absence of major recent long-term support between the current zone and those historical levels explains why the present area is particularly important for the medium-term outlook.
The Kiwi's weakness goes beyond a stronger US Dollar
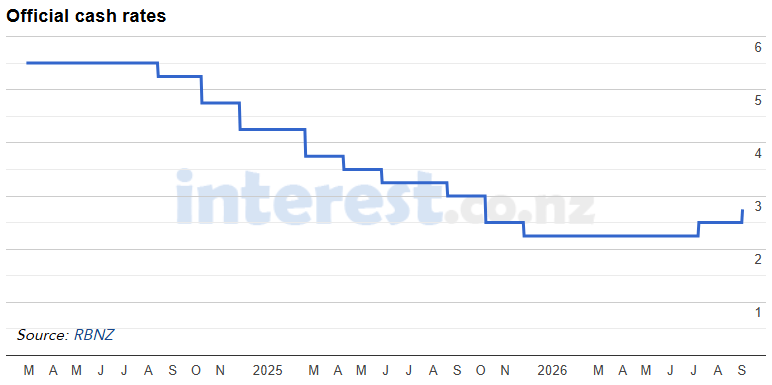
The technical deterioration is taking place against an increasingly challenging fundamental backdrop for the New Zealand Dollar. The Kiwi was the worst-performing G10 currency in September, according to MUFG, despite the Reserve Bank of New Zealand (RBNZ) raising the Official Cash Rate (OCR) by 25 basis points to 2.75%. MUFG argues that investors were disappointed by the lack of stronger guidance on future tightening and warns that high-beta currencies such as the NZD remain particularly vulnerable in an environment of rising global yields.
This distinction matters because recent weakness is not simply a reflection of US Dollar strength. The New Zealand Trade Weighted Index (TWI) has fallen to a fresh 15-year low of 63.7, according to BNZ. The bank describes the combination of a “low-yielding, high-risk currency” as particularly unfavorable in the current market environment and argues that relatively low New Zealand interest rates are contributing significantly to the currency's depreciation.
MUFG points to another headwind for the New Zealand Dollar: its vulnerability to rising global bond market volatility. The bank warns that “high-beta FX will be more vulnerable in a climate where yields are rising sharply,” adding that more challenging financial conditions in the coming months could see the NZD underperform.
The relationship is increasingly visible in recent price action. As the ICE BofA MOVE Index, a gauge of expected US Treasury market volatility, has risen sharply since September, NZD/USD has moved in the opposite direction and fallen toward mid-0.56.
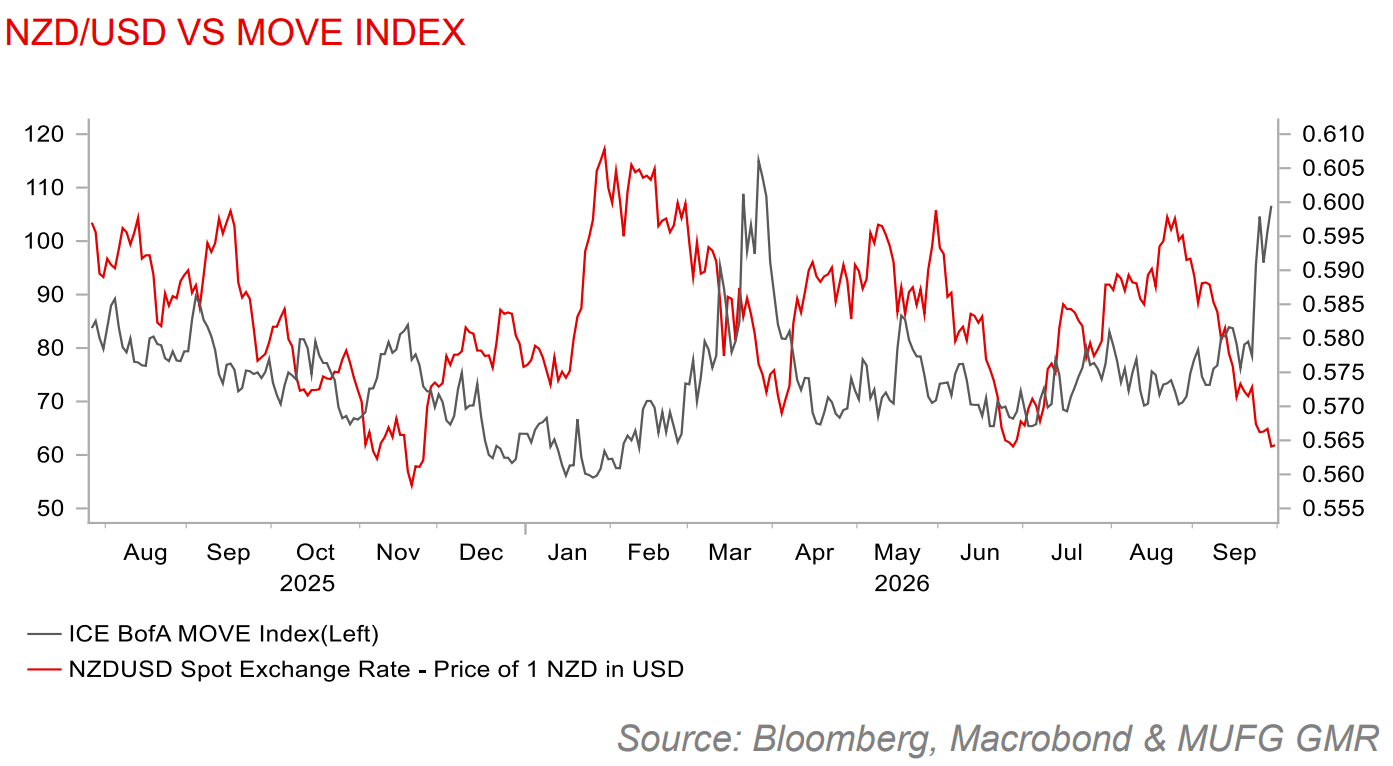
The divergence highlights the Kiwi's sensitivity to deteriorating global financial conditions, particularly when higher bond yields and volatility encourage investors to reduce exposure to risk-sensitive currencies, like the NZD.
The weakness is also visible against currencies other than the US Dollar. The New Zealand Herald reported that between August 24 and September 29 the Kiwi lost 5.1% against the US Dollar, 3.1% against the Australian Dollar and 4.6% against the RBNZ's basket of currencies. That broad underperformance suggests domestic factors are playing an important role alongside global risk aversion and US Dollar strength.
The weak New Zealand Dollar is becoming an inflation problem for the RBNZ
The currency's decline also creates a dilemma for the RBNZ ahead of its October 28 monetary policy decision. A weaker Kiwi raises the domestic cost of imported goods and commodities, potentially increasing inflationary pressure at a time when elevated energy prices are already complicating the inflation outlook.
BNZ Strategist Jason Wong argues that the RBNZ's relatively easy monetary stance has compressed New Zealand's interest-rate differentials against the rest of the world, contributing to a historically weak currency. “The RBNZ’s easy policy stance is a key reason why the NZD is trading at historically suppressed levels,” Wong said.
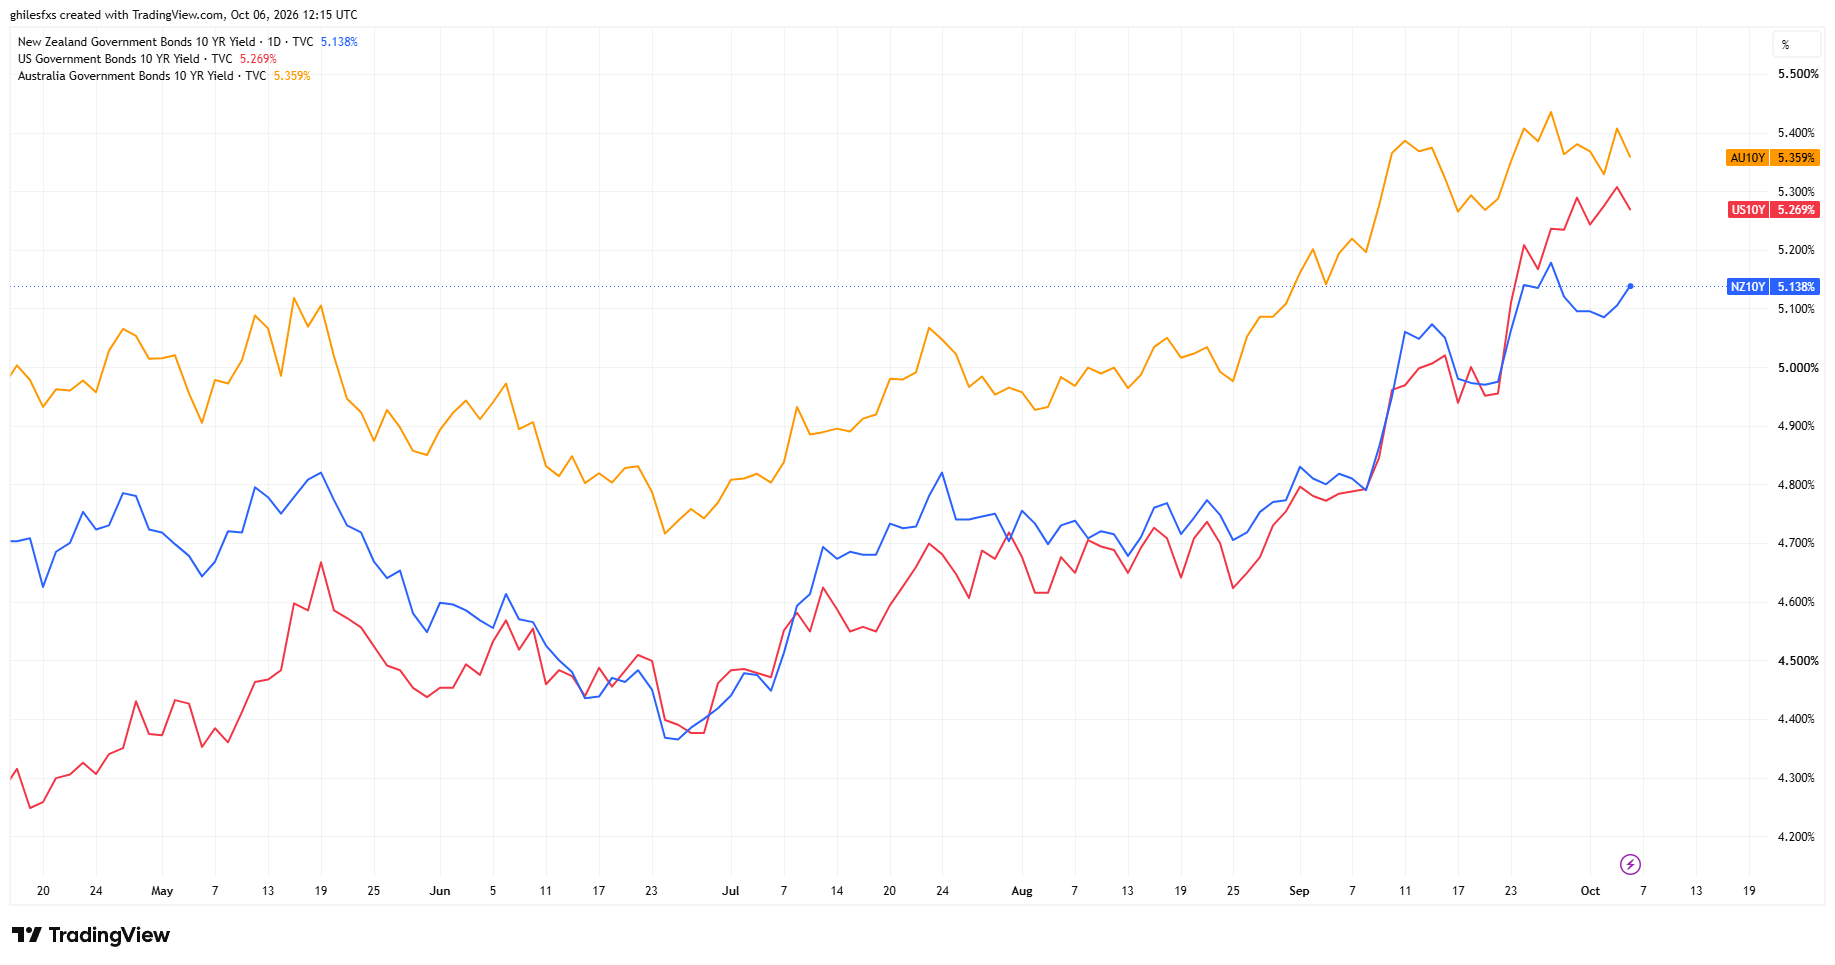
BNZ also estimates that the weaker exchange rate could add around 0.3 percentage points to its annual Consumer Price Index (CPI) forecast on top of the impact from higher Oil prices. The bank now expects the RBNZ to raise rates by 25 basis points in October and sees further increases eventually taking the OCR to 3.75%.
The feedback loop is important for NZD/USD. Currency weakness increases imported inflation, stronger inflation increases pressure on the central bank to tighten monetary policy, and a more aggressive tightening cycle could eventually provide support to the currency. But the opposite is also possible. Wong warned that a gentler RBNZ tightening path “might instead limit any currency recovery and skew our NZD forecasts to the downside.”
BNZ has already become more cautious on the currency. After maintaining a positive medium-term view in August and targeting a sustained break above 0.6000 by early 2027, the bank said in late September that a sustained move above 0.6000 over the coming year was no longer its base case.
October's RBNZ meeting could test the bearish narrative
The October 28 RBNZ meeting therefore arrives at an important moment for the currency. Markets are pricing in around a 58% chance of a 25-basis-point increase to 3.00% later this month, according to Reuters, while a December increase is fully priced in.
However, recent economic evidence does not provide a straightforward answer for policymakers. New Zealand's economy expanded 0.2% QoQ in the second quarter, exceeding the RBNZ's expectation for no growth, while annual growth reached 2.6%, its fastest pace in three years. BNZ argues that this suggests spare capacity may be disappearing faster than the central bank expects.
At the same time, the latest New Zealand Institute of Economic Research (NZIER) Quarterly Survey of Business Opinion showed a sharp improvement in sentiment. A net 43% of firms expect general business conditions to improve, compared with just 8% in the previous quarter. Yet the survey also provided some reassurance on inflation. Cost and pricing indicators stabilized despite higher fuel prices, leading NZIER Principal Economist Christina Leung to argue that no additional cash rate increases are necessary this year.
That puts the RBNZ between competing forces: a weak currency, elevated energy costs and stronger-than-expected economic activity argue for tighter policy, while easing business pricing pressures and uncertainty surrounding the economic outlook support a more cautious approach.
The New Zealand third-quarter Consumer Price Index (CPI) release on October 21, one week before the RBNZ decision, could therefore become particularly important for rate expectations and the Kiwi.
0.5580-0.5470 could determine the next major NZD/USD move
The technical and fundamental pictures are increasingly converging around the same question. NZD/USD has returned to a zone that has repeatedly attracted buyers since 2020, but it does so after six consecutive weekly losses, with declining 100-week and 200-week moving averages and a multi-year sequence of progressively lower recovery highs.
A defense of 0.5580-0.5470 could give oversold conditions room to unwind and put 0.6000 back on traders' radar, followed by the 2025 peaks around 0.6100. A break below the zone would instead mark a significant deterioration in the long-term structure and expose historical levels around 0.5200 and potentially the 0.5000-0.4900 region.
Fundamentals could ultimately decide which scenario prevails. The RBNZ is approaching a meeting where the weakness of its own currency has become part of the inflation problem it is trying to solve.
For NZD/USD, that leaves a support zone that has survived every major test since 2020 facing another one, with the long-term trend increasingly leaning against it.
New Zealand Dollar FAQs
The New Zealand Dollar (NZD), also known as the Kiwi, is a well-known traded currency among investors. Its value is broadly determined by the health of the New Zealand economy and the country’s central bank policy. Still, there are some unique particularities that also can make NZD move. The performance of the Chinese economy tends to move the Kiwi because China is New Zealand’s biggest trading partner. Bad news for the Chinese economy likely means less New Zealand exports to the country, hitting the economy and thus its currency. Another factor moving NZD is dairy prices as the dairy industry is New Zealand’s main export. High dairy prices boost export income, contributing positively to the economy and thus to the NZD.
The Reserve Bank of New Zealand (RBNZ) aims to achieve and maintain an inflation rate between 1% and 3% over the medium term, with a focus to keep it near the 2% mid-point. To this end, the bank sets an appropriate level of interest rates. When inflation is too high, the RBNZ will increase interest rates to cool the economy, but the move will also make bond yields higher, increasing investors’ appeal to invest in the country and thus boosting NZD. On the contrary, lower interest rates tend to weaken NZD. The so-called rate differential, or how rates in New Zealand are or are expected to be compared to the ones set by the US Federal Reserve, can also play a key role in moving the NZD/USD pair.
Macroeconomic data releases in New Zealand are key to assess the state of the economy and can impact the New Zealand Dollar’s (NZD) valuation. A strong economy, based on high economic growth, low unemployment and high confidence is good for NZD. High economic growth attracts foreign investment and may encourage the Reserve Bank of New Zealand to increase interest rates, if this economic strength comes together with elevated inflation. Conversely, if economic data is weak, NZD is likely to depreciate.
The New Zealand Dollar (NZD) tends to strengthen during risk-on periods, or when investors perceive that broader market risks are low and are optimistic about growth. This tends to lead to a more favorable outlook for commodities and so-called ‘commodity currencies’ such as the Kiwi. Conversely, NZD tends to weaken at times of market turbulence or economic uncertainty as investors tend to sell higher-risk assets and flee to the more-stable safe havens.
Author

Ghiles Guezout
FXStreet
Ghiles Guezout is a Market Analyst with a strong background in stock market investments, trading, and cryptocurrencies. He combines fundamental and technical analysis skills to identify market opportunities.

















