The market finally picked a side - Now comes the real test
After several sessions of waiting, a few markets are finally starting to show their hand.
The Dollar has delivered the bullish breakout we were waiting for, while metals are trying to defend key support zones and rebuild momentum. At the same time, several soft commodities remain trapped in consolidation, which means patience is still part of the strategy. Today’s roadmap is simple: respect confirmed breakouts, watch the invalidation levels, and don’t force trades where the market still hasn’t made a decision.
Dollar (DX.F)
Let’s open today’s Lab Note by revisiting recent quote:
“(...) only a daily close outside either side of this structure - above 99.15 or below 98.72 - would bring something genuinely new to the table and help determine the next larger move. (...)”
And this time, the market finally made its choice.
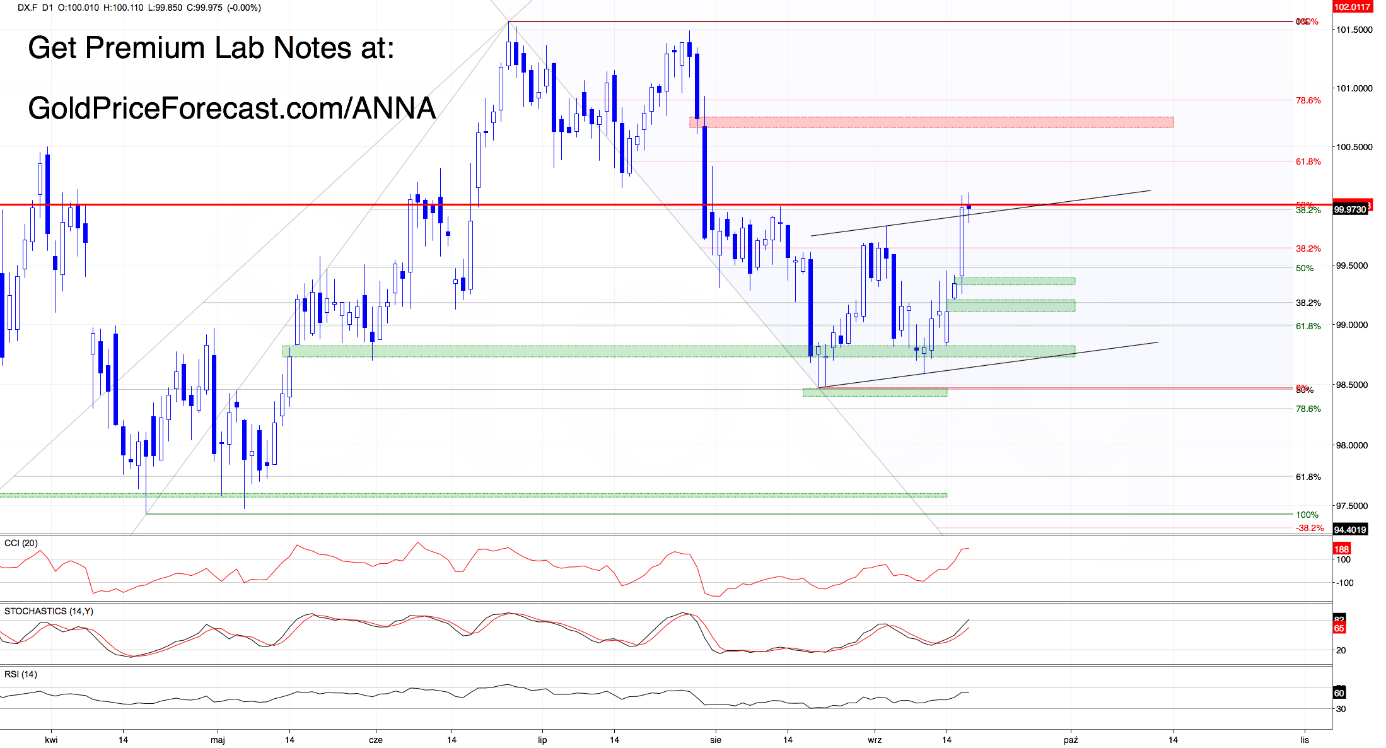
From today’s perspective, the situation developed exactly in line with our bullish scenario. Buyers managed to close not only above the large bearish gap at 98.80-99.15, but also above the upper boundary of the black rising channel.
From there, they went straight after the psychological 100 barrier.
Along the way, bulls also tested another important resistance area built around the highs from the first half of August and the 50% Fibonacci retracement of the previous decline.
And they didn’t arrive empty-handed. The move also created two bullish gaps: 99.10-99.22 from September 15 and 99.34-99.40 from September 16.
What happens next?
Today brought a pullback and a test of yesterday’s broken upper boundary of the rising channel.
That matters because as long as the earlier breakout remains valid, bulls are still in the game - especially with the buy signals still active. The next bullish trigger is pretty straightforward: a daily close above 100 would open the road toward 100.37.
If buyers manage to break through that resistance as well, their next target would likely be the bearish gap at 100.67-100.72 from July 30.
What would ruin the bullish plan? A daily close below the black support line, currently around 99.92.
That would invalidate yesterday’s breakout and put bears back in control. Their first target would then be the 99.59-99.69 support zone, followed - if that area breaks - by the first bullish gap below.
Dollar Takeaway
Watch 99.92-100.00.
Daily close above 100 → bullish continuation toward 100.37, then potentially 100.67-100.72.
Daily close below 99.92 → breakout invalidated; watch 99.59-99.69 and the bullish gap below.
Palladium (PA.F)
Not much has changed technically here.
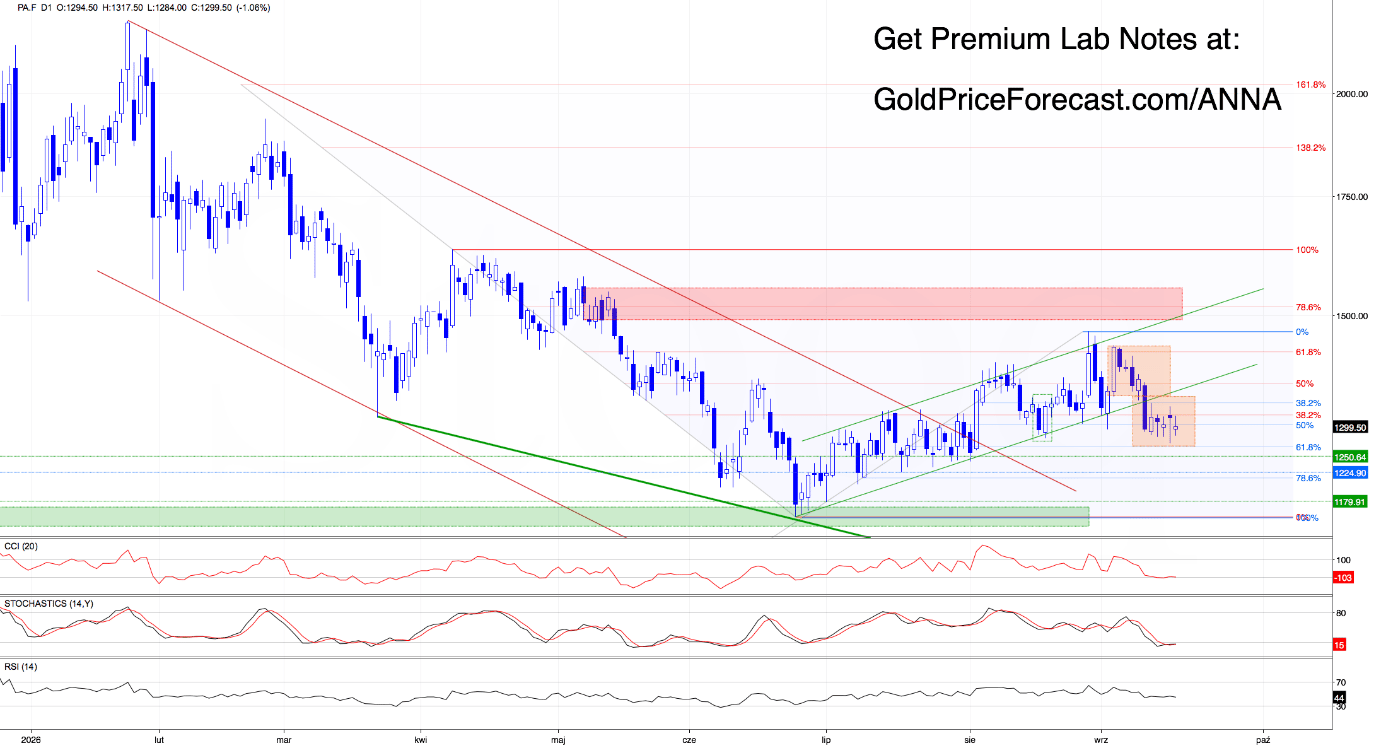
Palladium remains below the broken lower boundary of the green rising channel, which means our previous comment remains up to date today as well:
“(...) price remains below the formation. From a technical perspective, that means today’s upswing is still only testing yesterday’s breakdown unless bulls manage to close the day back above the lower boundary of the channel.
Given the size of yesterday’s black candle, however, we believe the bullish picture would improve more convincingly only after a close above yesterday’s bearish gap at 1370-1381.
There’s another thing worth keeping on the radar.
If bulls fail to invalidate yesterday’s breakdown, two bearish scenarios remain on the table. The first is based on the orange consolidation, with a downside target around 1266 - the 61.8% Fibo. The second comes from the green rising channel, pointing toward another downside target around 1226. (...)”
Palladium Takeaway
Watch the broken lower boundary of the green rising channel.
Reclaim it → first sign that the breakdown is being invalidated.
Daily close above 1370-1381 → much stronger bullish improvement.
Breakdown remains valid → bearish targets stay at 1266, then potentially 1226.
Copper (HG.F)
Important Note on Copper
Before we get into today’s Copper chart, there’s something important I need to flag.
The historical daily data on HG.F has changed since our Friday analysis. The September 10 candle currently displayed on the chart is materially different from the candle that was visible when Friday’s Lab was prepared.
In other words, this is not a price move that was overlooked in Friday’s analysis. The historical D1 chart itself has changed retrospectively.
I still need to determine whether this was caused by a data-feed correction, the construction of the continuous futures series, or another issue with the historical data, so I’m not going to speculate about the cause.
For now, please keep this discrepancy in mind when comparing the current Copper chart with Friday’s Lab. I’ll base today’s update on the data currently available and adjust the roadmap where necessary.
So, what does the current chart tell us?
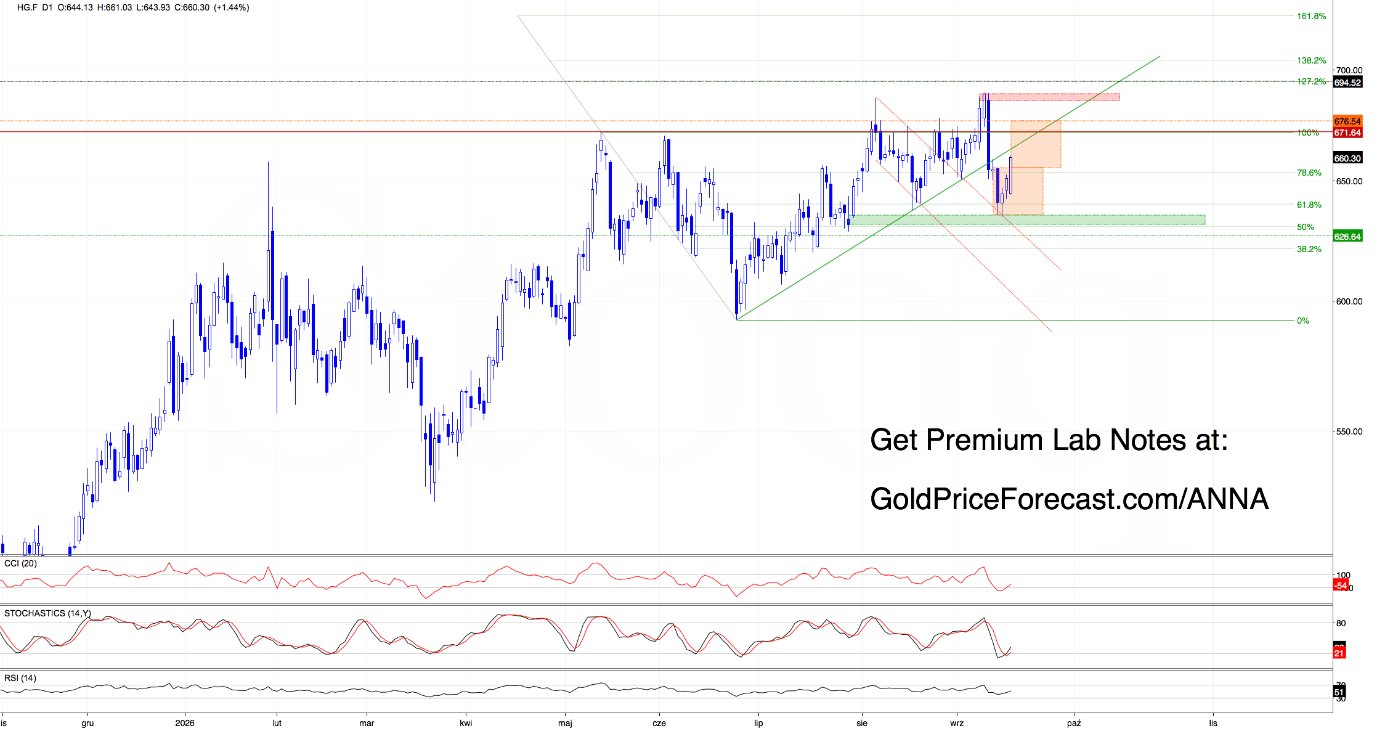
Copper reached an important support area built around two technical elements: the 631.15-634.95 bullish gap from July 30 and the previously broken upper boundary of the red declining channel.
And buyers reacted.
The result was a several-day consolidation between 635.15 and 655.25 and today we’re seeing an attempt to break above its upper boundary.
If bulls manage to close the day above 655.25, their next target will be the broken green line, which now serves as the nearest resistance.
If they manage to reclaim that line as well, the bullish scenario based on the size of the consolidation would likely come back into play, potentially taking Copper toward at least 676.54 over the next several days.
What invalidates the bullish scenario? A daily close below 631.15.
Copper Takeaway
Watch 655.25.
Daily close above 655.25 → next test: the broken green resistance line.
Break above that line → bullish consolidation target around 676.54 comes into play.
Daily close below 631.15 → bullish scenario invalidated.
Cotton #2 - ICE (CT.F)
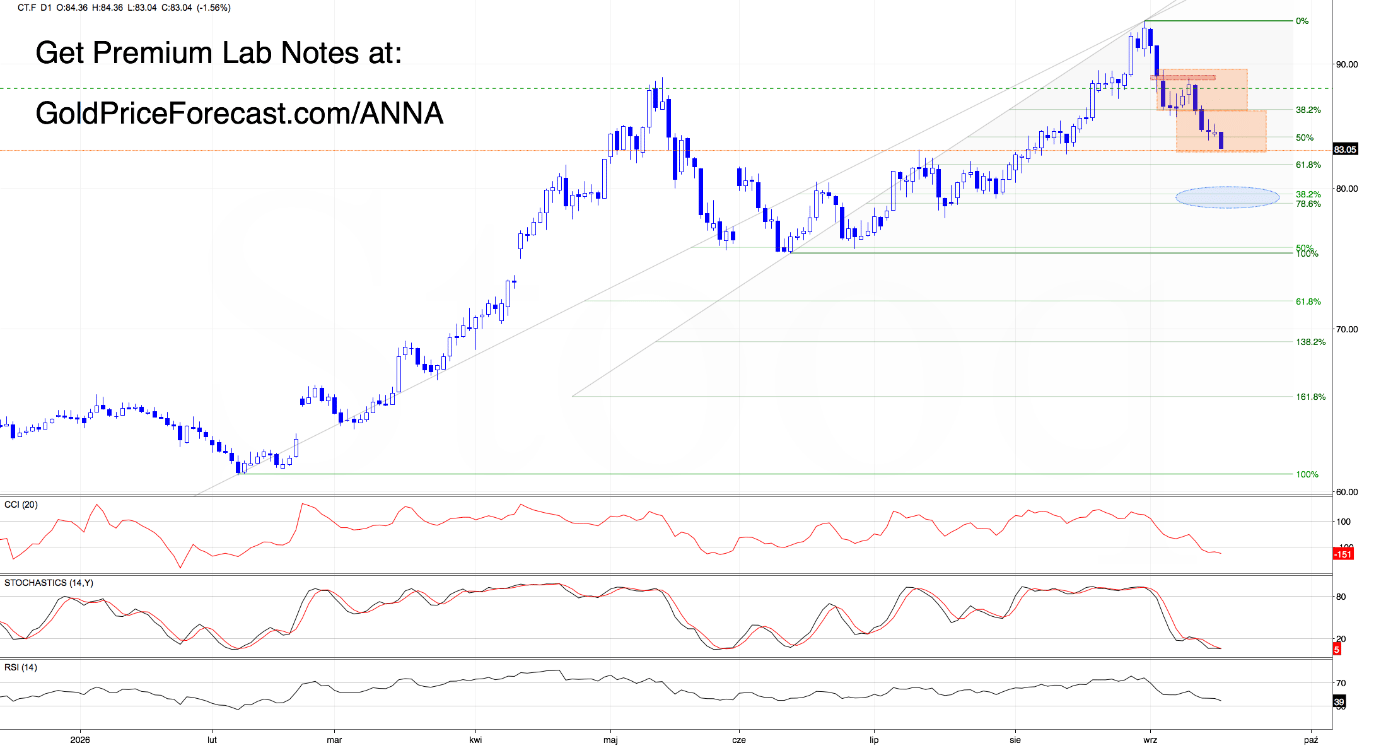
We’ll start exactly where we left off:
“(...) Cotton remains trapped in a narrow range between the 38.2% Fibo and the bearish gap at 88.55-89.33 from the beginning of the month - essentially an orange consolidation.
What does that tell us?
We still need a daily close outside this range before something genuinely new enters the technical picture.
Bearish scenario: a daily close below 86.10 would open the road toward 82.90.
Until one of those levels breaks, the range remains the story. (...)”
And the market finally made its move.
Monday brought a breakdown below 86.10, triggering our bearish scenario. Today, sellers reached 82.83, effectively delivering the 82.90 target (congratulations to everyone who followed that move and added a little something to the trading account along the way!).
What happens next?
Today’s price action also produced a breakdown below the 50% Fibonacci retracement of the entire previous advance.
That suggests the decline may not be finished yet. The 81.85 area could now be the next battleground and potentially decide the direction of the next move.
If bulls defend that support, a move back toward the broken lower boundary of the orange consolidation would be the first step toward recovering lost ground.
If buyers lose 81.85, however, sellers could get another opening - this time toward the important support area around 80.
Cotton Takeaway
Bearish target 82.90 achieved - today’s low reached 82.83.
Now watch 81.85.
Hold 81.85 → rebound toward the broken orange consolidation becomes possible.
Break below 81.85 → opens the road toward the key support area around 80.
ATL cheat sheet - September 17
Dollar (DX.F): Watch 99.92-100.00. Break above 100 → 100.37, then 100.67-100.72. Break below 99.92 → 99.59-99.69.
Palladium (PA.F): Watch the broken lower boundary of the green rising channel. Reclaim it → first bullish improvement. Break above 1370-1381 → stronger confirmation. Breakdown remains valid → 1266, then potentially 1226.
Copper (HG.F): Watch 655.25. Break above → test of the broken green resistance line. Reclaim that line → 676.54 comes into play. Break below 631.15 → bullish scenario invalidated.
Cotton #2 (CT.F): Bearish target 82.90 achieved. Now watch 81.85. Hold → rebound toward the broken consolidation becomes possible. Break below → next important support around 80.
Bottom line: Several markets have finally started moving, but confirmation still matters. Where the breakout is already in place, we follow it until the market invalidates it. Where price is still trapped in a range, we wait. No breakout, no breakdown, no need to invent a trade.
Stay sharp, stay patient, and don’t force trades in unclear conditions.
Want free follow-ups to the above article and details not available to 99%+ investors? Sign up to our free newsletter today!
Author

Anna Radomska
Gold Price Forecast
Anna's passion for drawing evolved into a fascination with colorful lines and shapes, which later inspired her interest in the stock market.