The major indices have a whippy, sideway, mostly trendless day – What's next for Nasdaq?

Recap 10/12 - The S&P opened flat and then traded 16 handles lower into a 9:33 AM low of the day. From that low, the S&P rallied 34 handles into a 9:45 AM high. From that high, the S&P declined 24 handles into a 10:22 AM low. From that low, the S&P rallied 25 handles into a 12:08 PM high of the day. From that high, the S&P declined 21 handles into a 2:02 PM low. From that low, the S&P rallied 17 handles into a 2:30 PM high. From that high, the S&P declined 27 handles into the close.
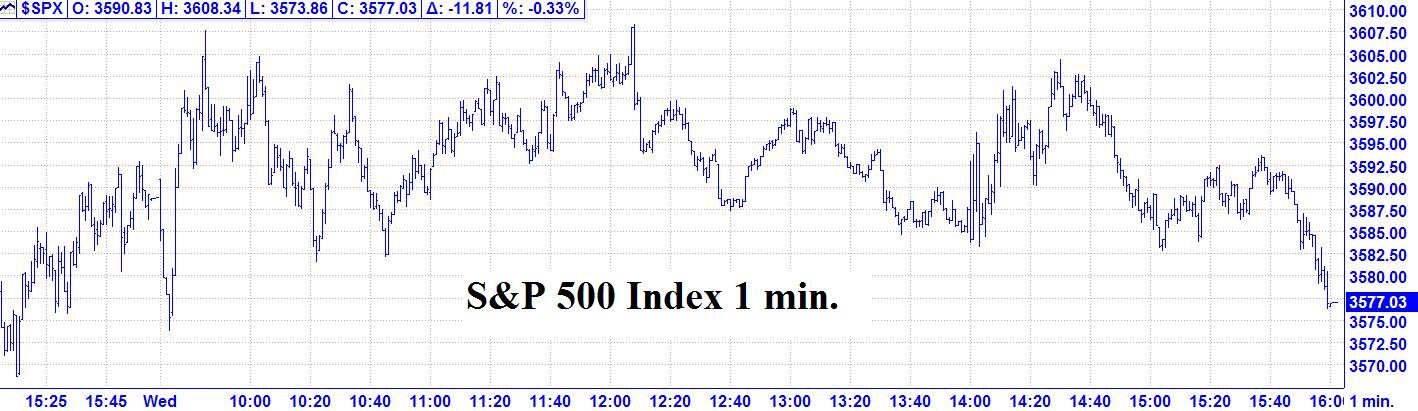
10/12 – The major indices had a whippy, sideway, mostly trendless day, to finish with the following closes: DJIA - 28.34; S&P 500 – 11.81 and the Nasdaq Comp. - 9.09.
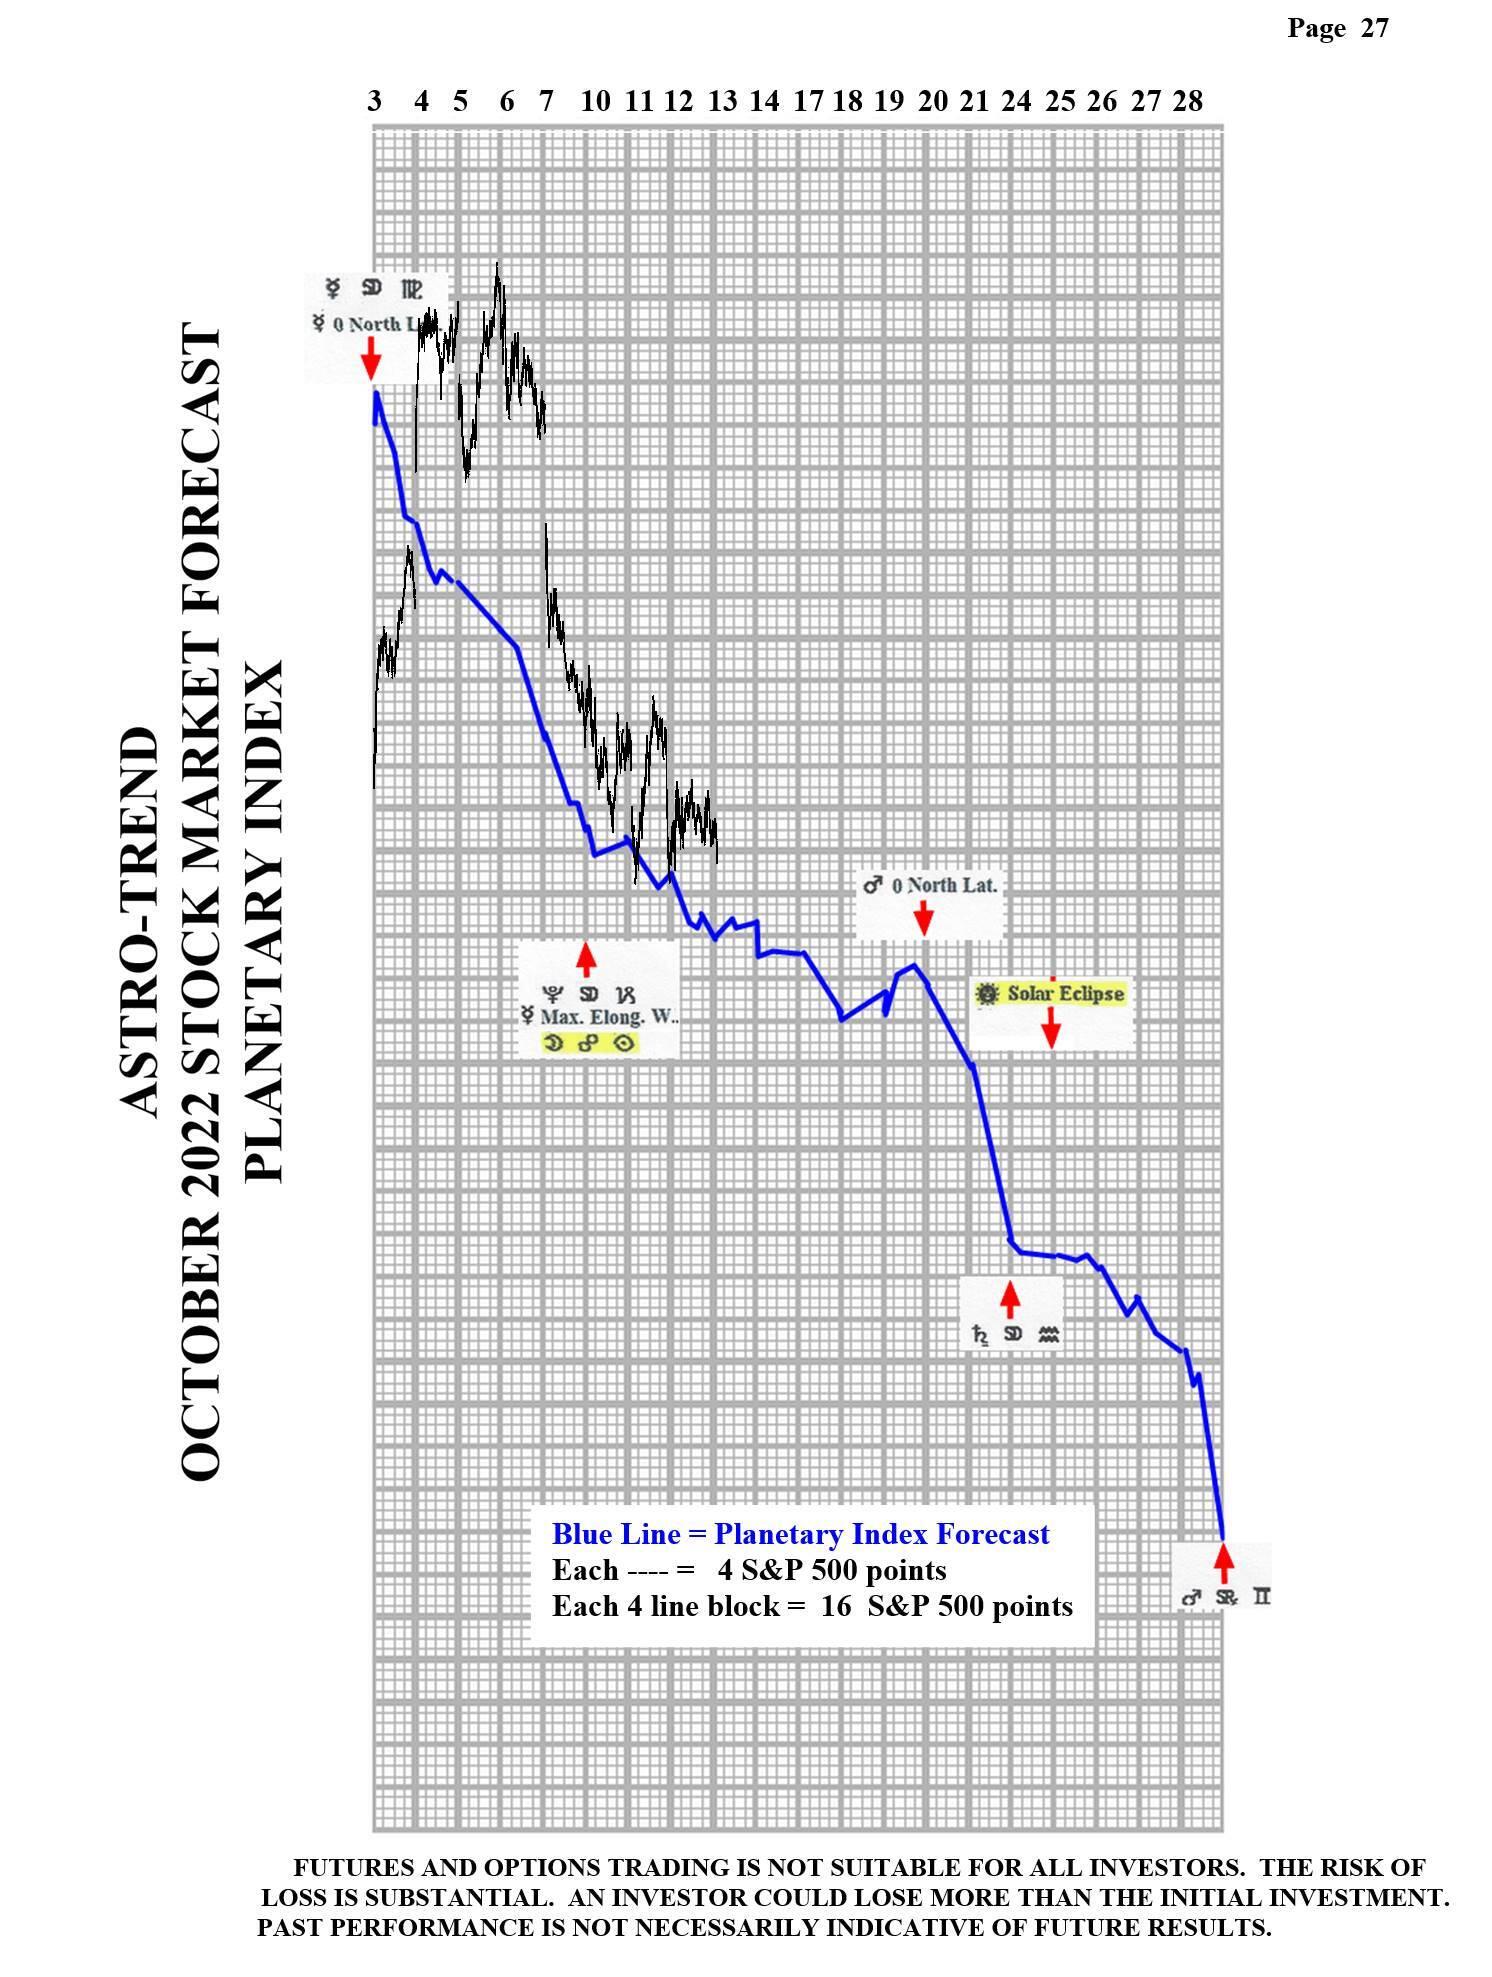
Looking ahead – There aren’t any major change in trend points for about one week. There is one Market Math point due on 10/13, which see below. The one thing in favor for the bulls is that the S&P 500 has now had six consecutive down days and statistically an up day is overdue.
The Now Index is in the NEUTRAL ZONE.
Coming events
(Stocks potentially respond to all events).
3. A. 10/19 AC – Mars 0 North Latitude. Major change in trend Corn, Gold, OJ.
B. 10/21 AC – Saturn in Aquarius turns Direct. Major change in trend Coffee, Copper.
C. 10/24 AC – New Moon – Solar Eclipse in Scorpio. Major change in trend Financials, Grains, Precious Metals, Cocoa, Hogs, T-Bonds.
D. 10/27 AC – Jupiter Retro Leaves Aries and enters Pisces. Change in trend Coffee, Corn, C.I., Gold, Oats, OJ, Oil, Sugar, Wheat.
E. 10/28 AC – Uranus 45 US Venus. Moderate change in trend US Stocks, T-Bonds, US Dollar.
F. 10/28 AC – Mars in Gemini turns Retrograde. Major change in trend Stocks.
Market Math
10/13 = 967 (Music) days > 2/19/2020 MAJOR HIGH.
10/18 = 287 (Music) days > 1/04/2022 MAJOR HIGH.
10/20 = 289 (13^) days > 1/04/2022 MAJOR HIGH.
Fibonacci – 10/18, 10/21, 10/24.
Astro – 10/20, 10/24, 10/28 AC.
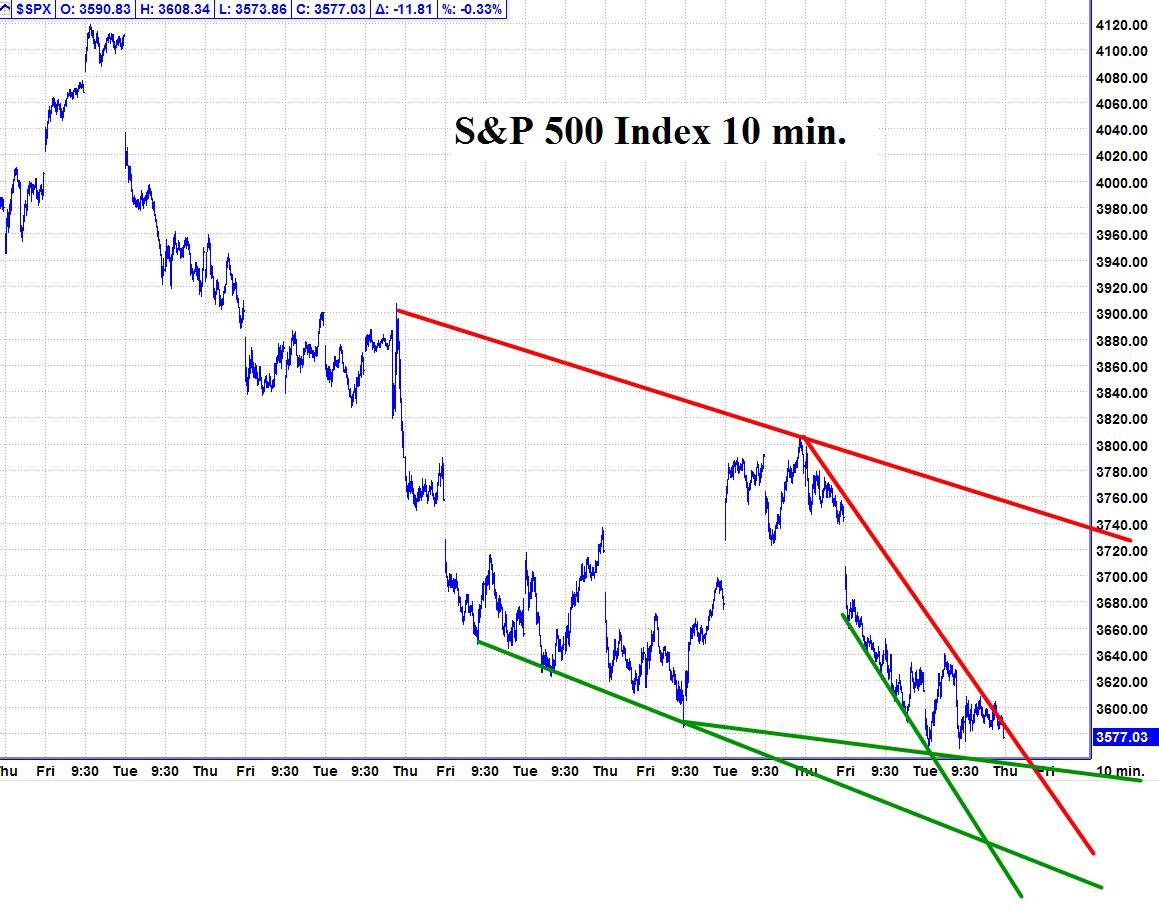
Please see below the S&P 500 10 minute chart.
Support - 3585, 3520 Resistance – 3600, 3720.
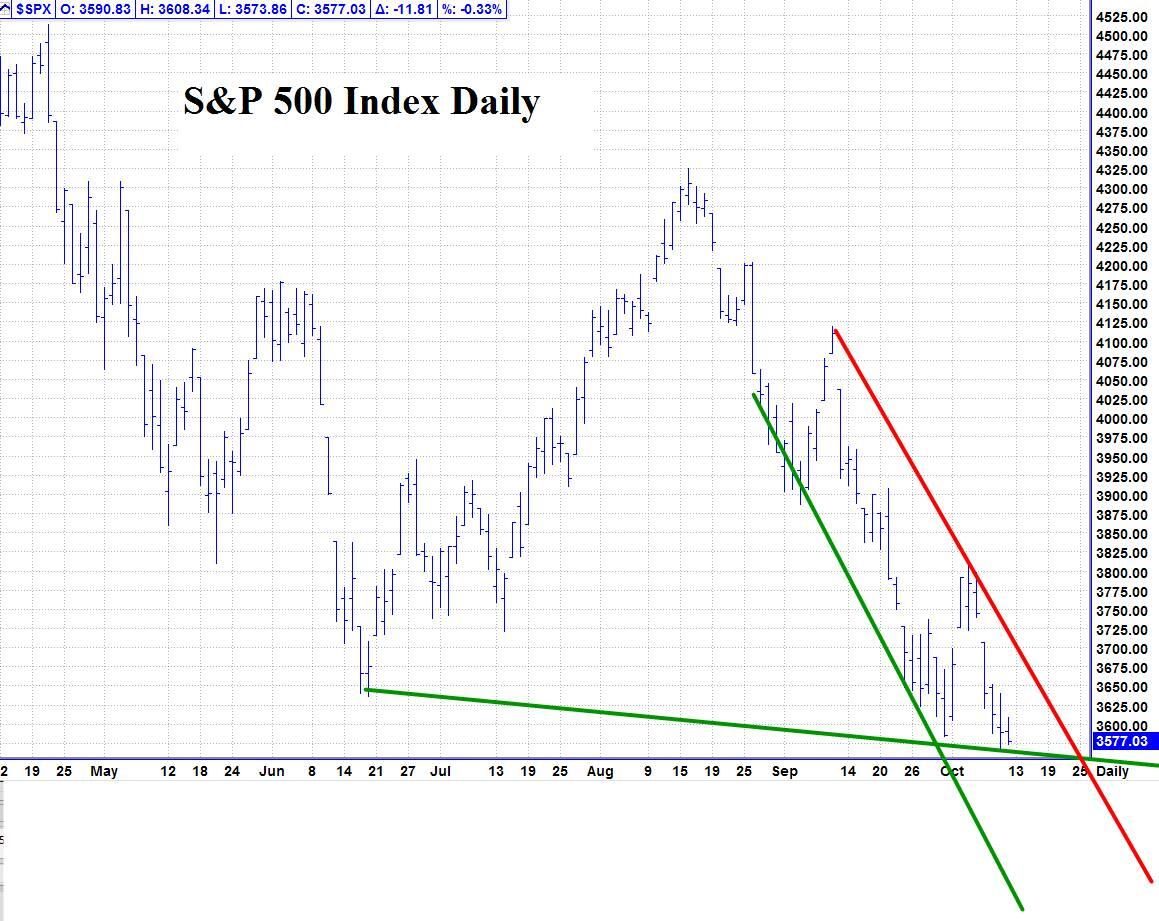
Please see below the S&P 500 Daily chart.
Support - 3585, 3520 Resistance – 3600, 3720.
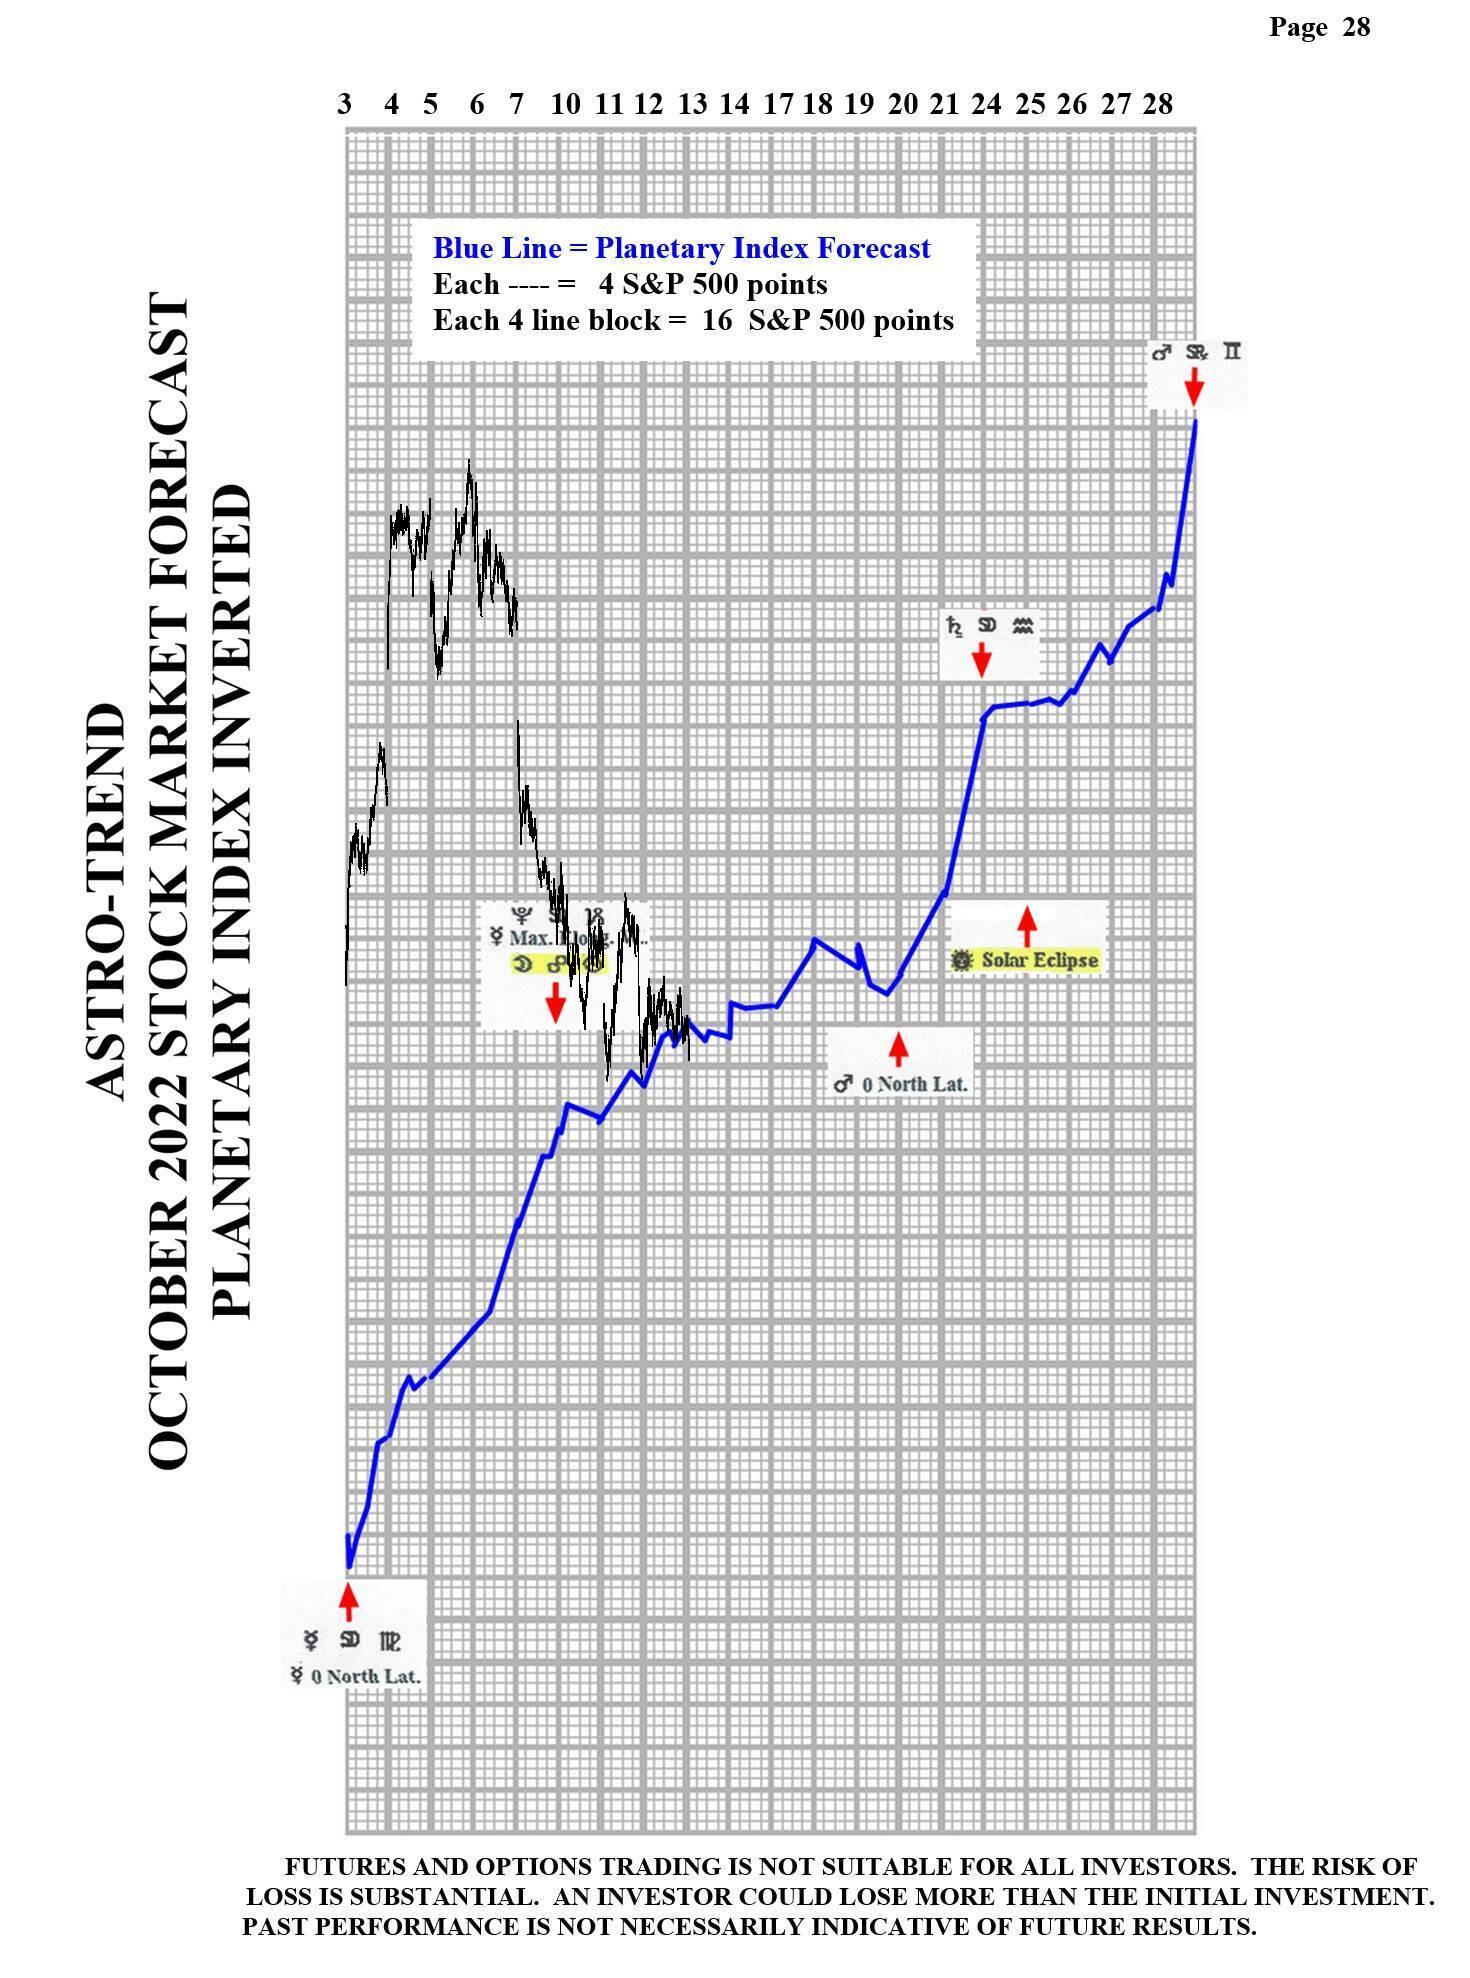
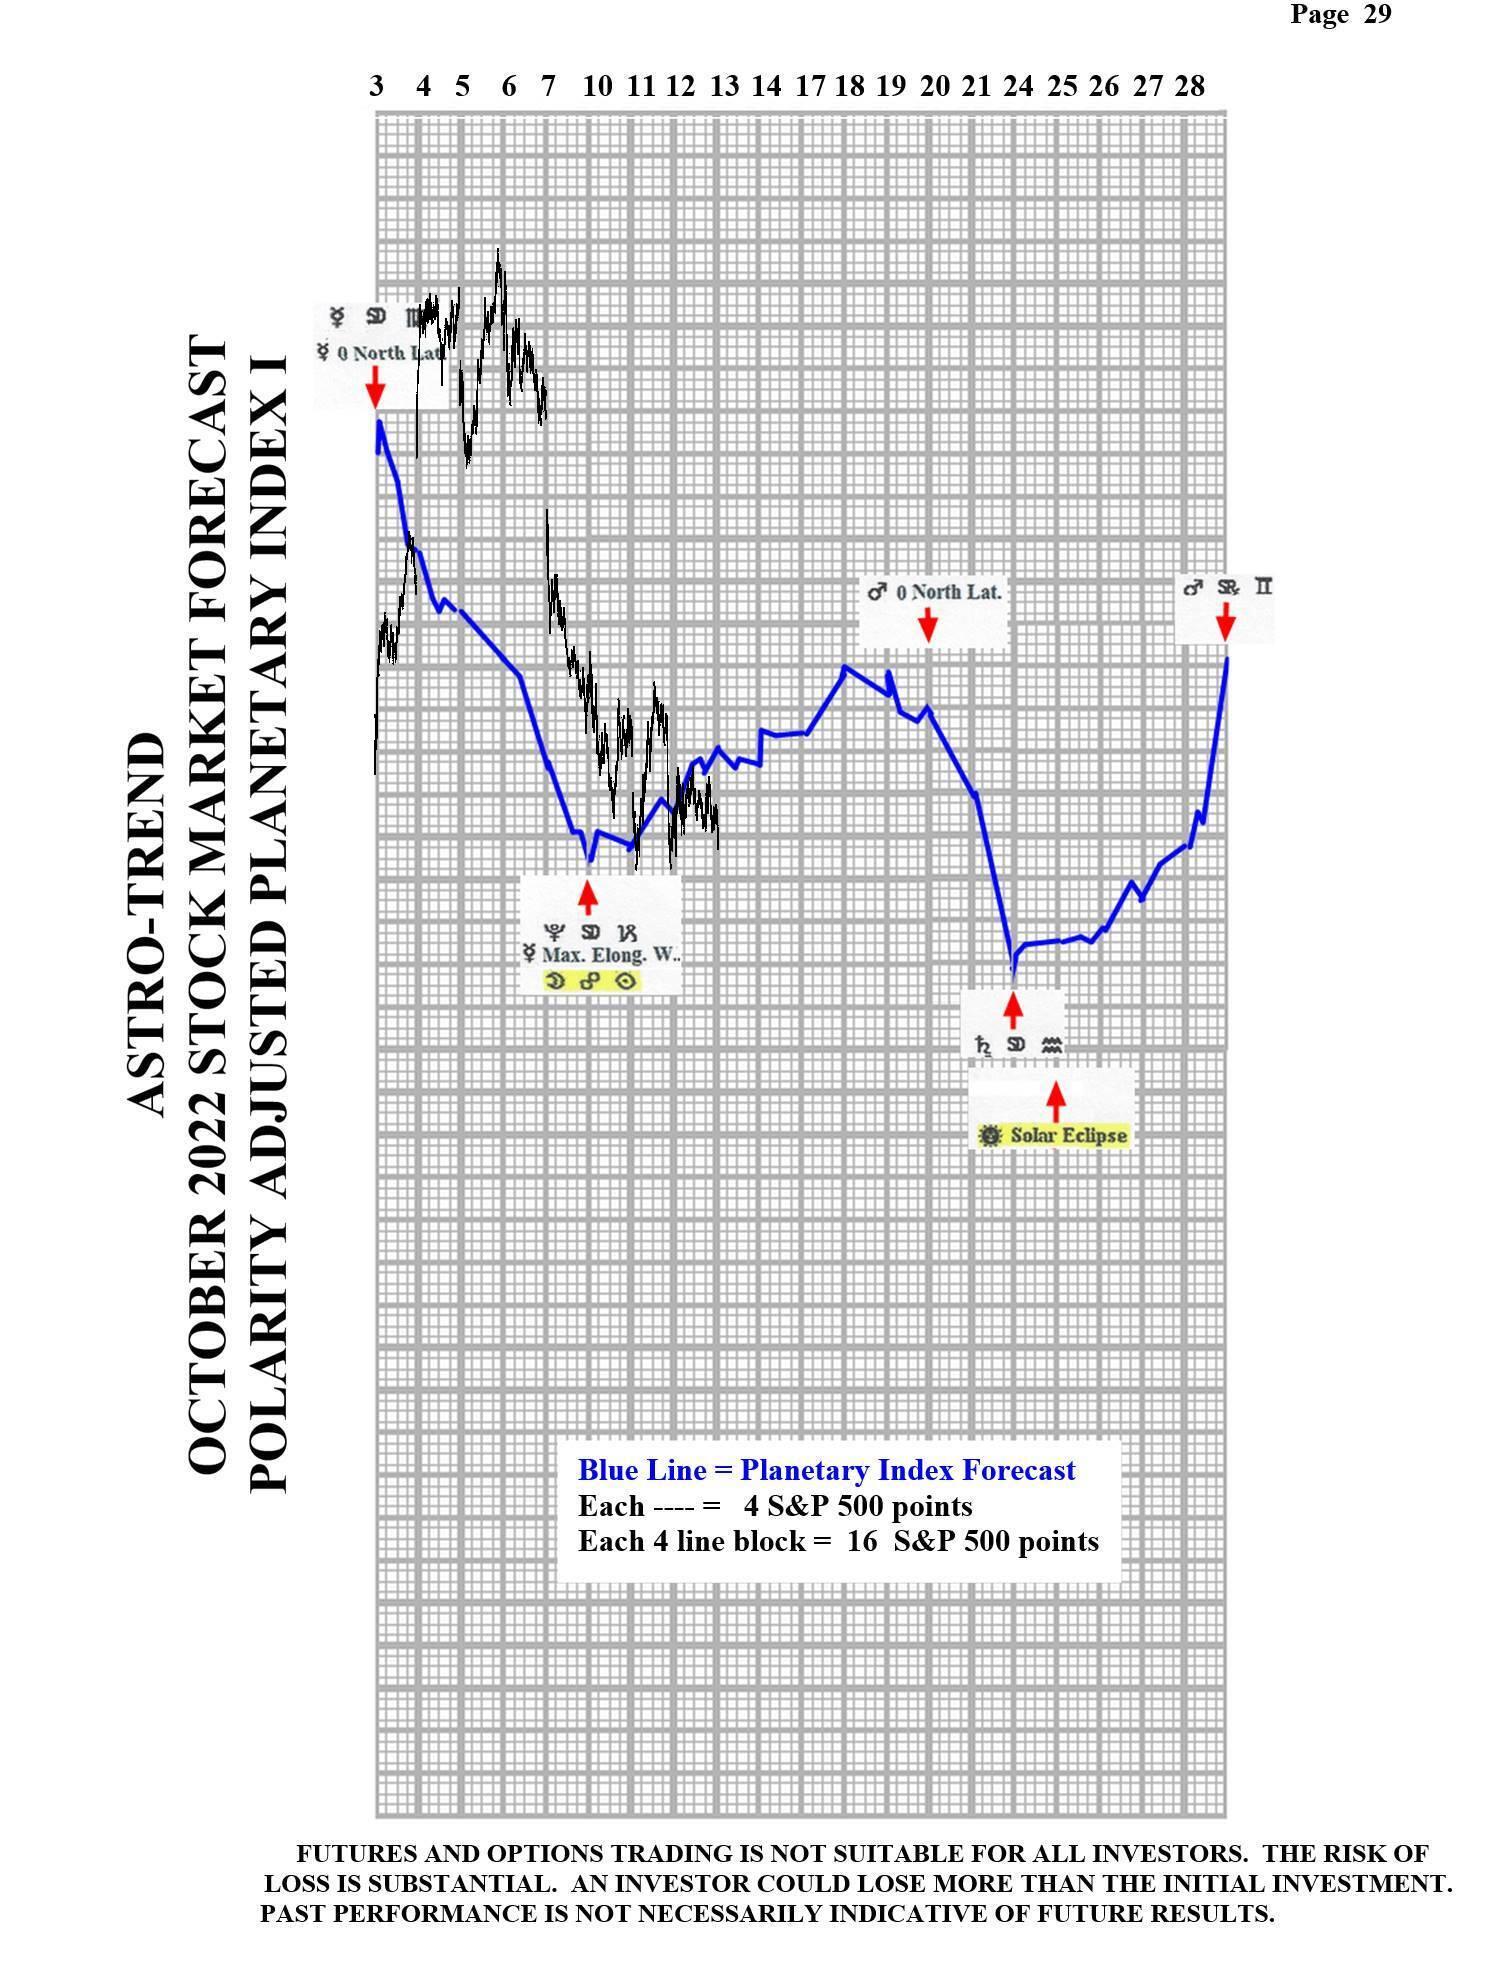
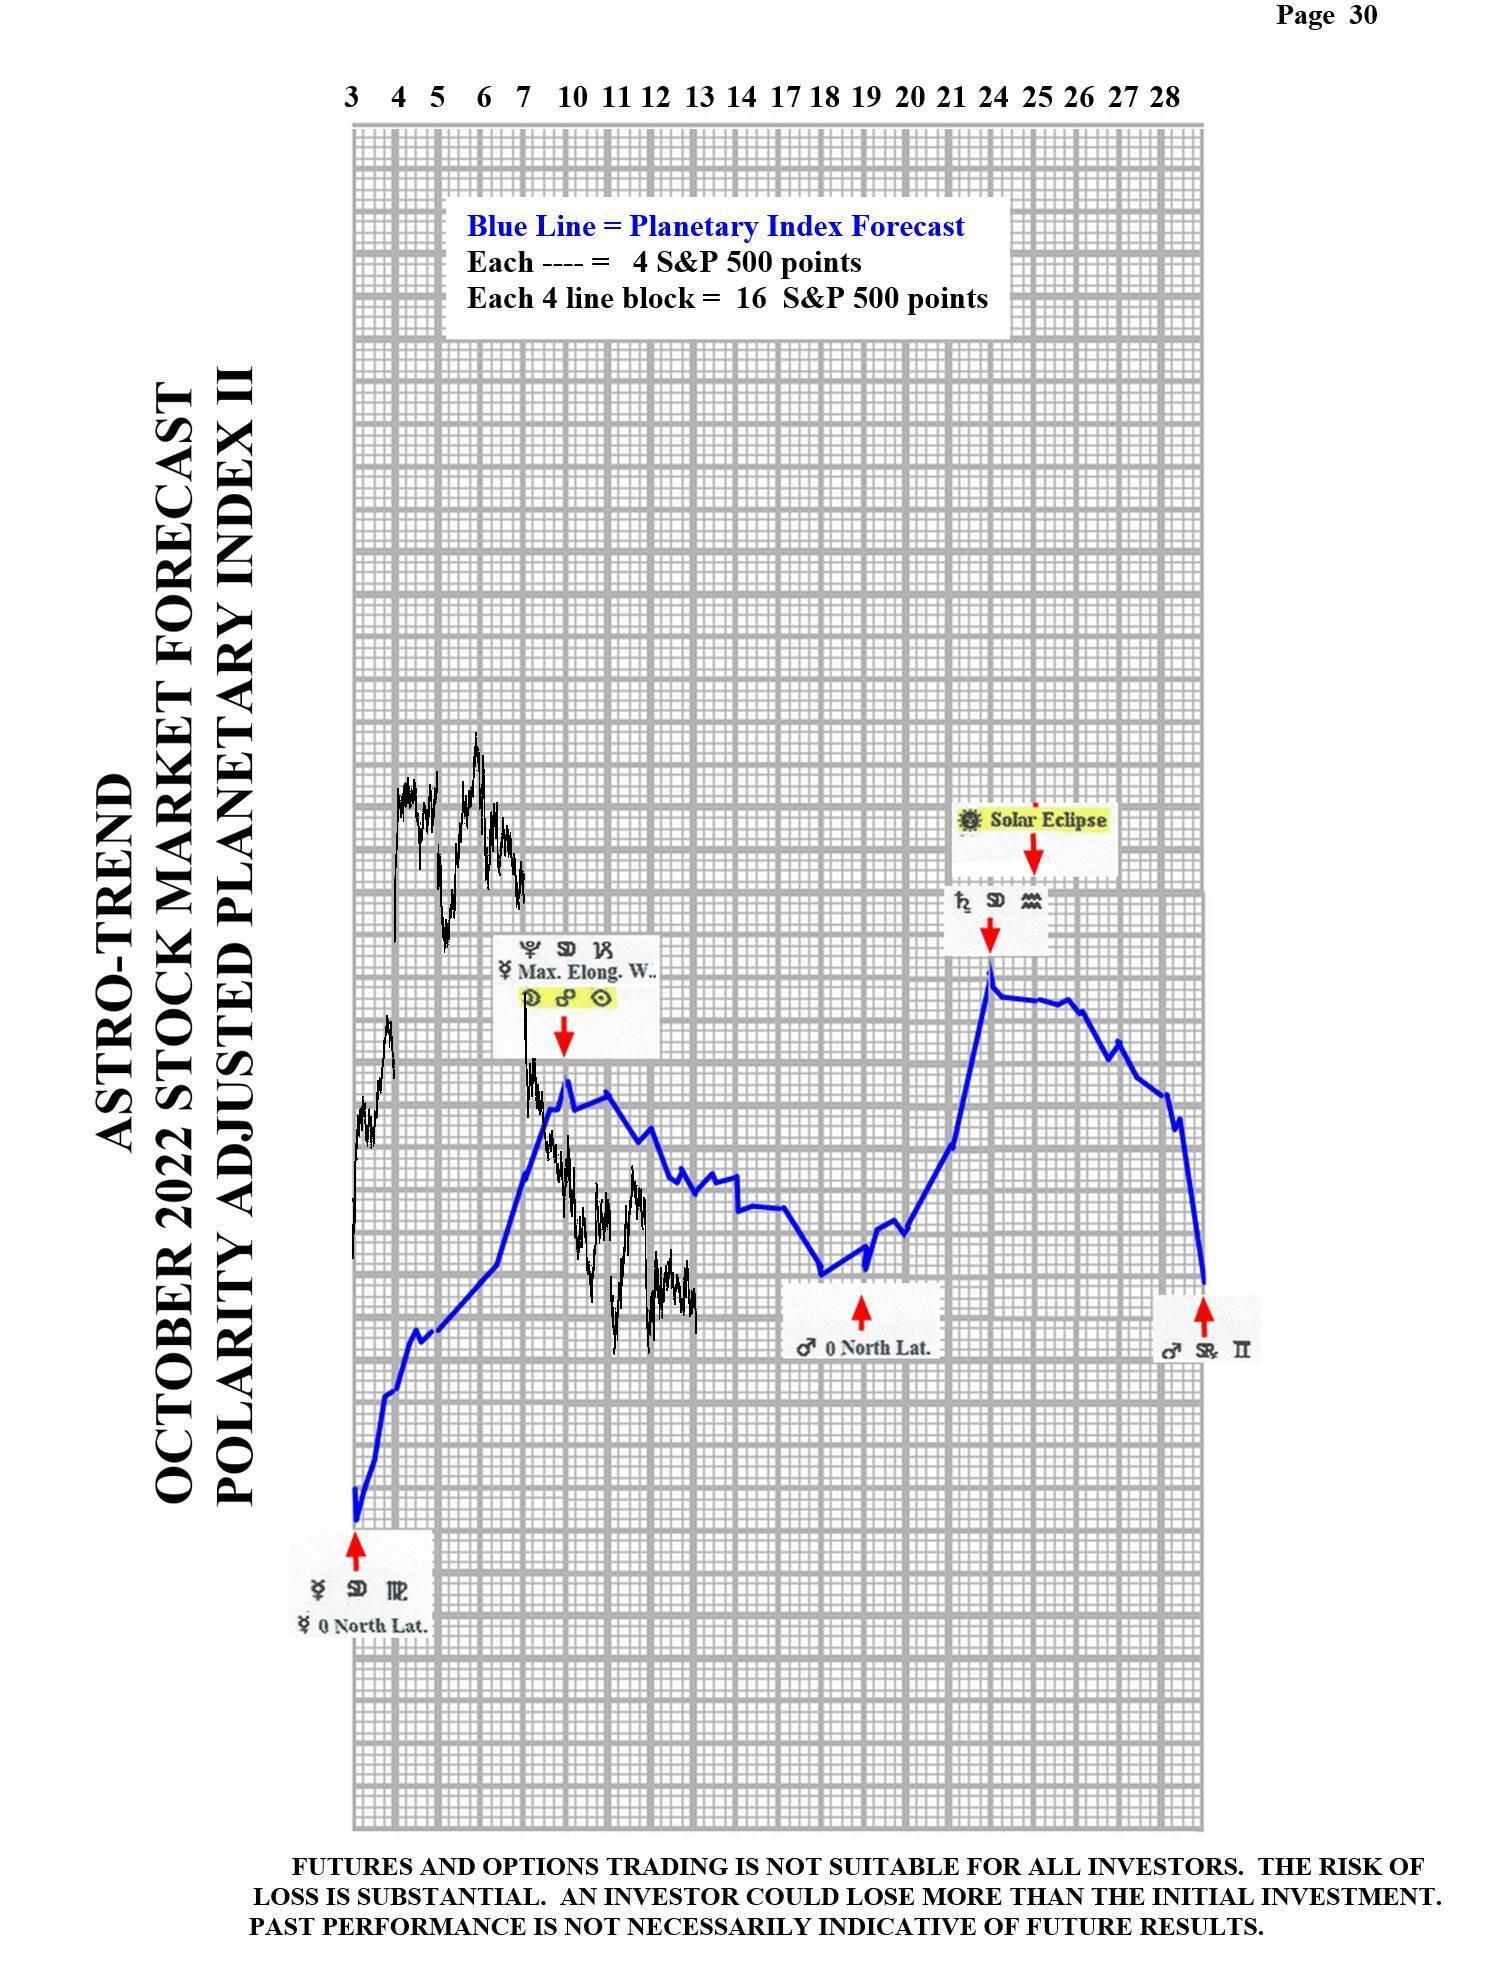
Please see below the September Planetary Index charts with S&P 500 5 minute bars for results.
Author

Norm Winski
Independent Analyst
www.astro-trend.com


