The major indices have a moderate down day – What's next for Nasdaq?

Recap 9/22 - The S&P opened with an 8 handle gap down and then traded another 33 handles lower into an 11:23 AM low of the day. From that low, the S&P rallied 34 handles into a 12:57 PM high. From that high, the S&P declined 22 handles into a 2:24 PM low. From that low, the S&P rallied 33 handles into a 3:46 PM high. From that high, the S&P declined 27 handles into the close.
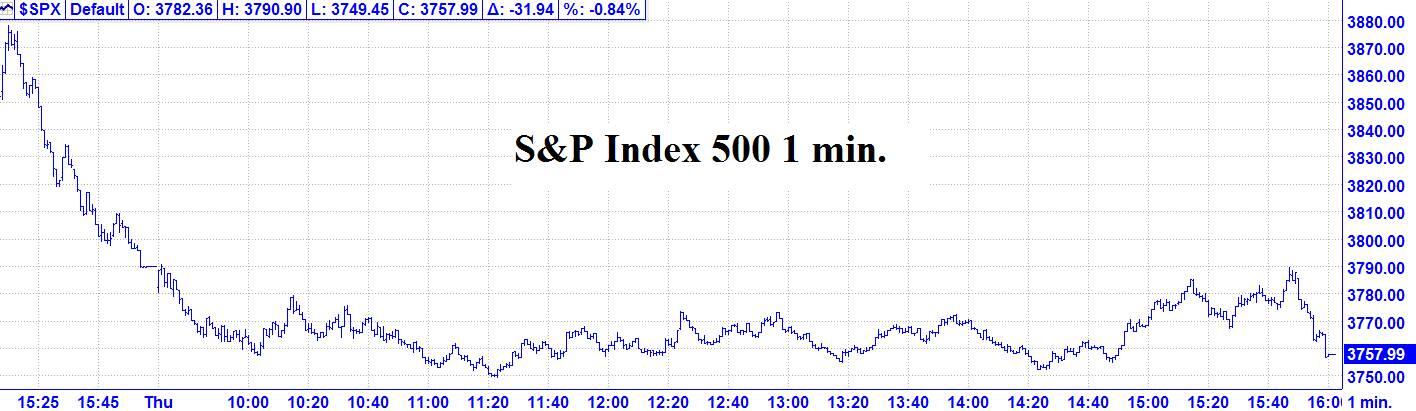
9/22 – The major indices had a moderate down day finishing per the following closes: DJIA – 107.10; S&P 500 - 31.94; and the Nasdaq Comp. - 153.94.
Looking ahead – Our next major change in trend point is the 9/23 AC New Moon. Additionally, we have one other point to consider with Fibonacci – 9/23. Please see details below.
The Now Index has moved back to the BUY ALERT ZONE. This is a cautionary indication that there is a moderate imbalance of too many shorts. This is not an outright buy signal.
Coming events
(Stocks potentially respond to all events).
2 G. 9/23 AC – New Moon in Libra. Major change in trend Financials, Grains, Precious Metals, Sugar, Wheat.
3. A. 9/26 AC – Moon’s North Node Contra-Parallel US Moon. Major change in trend US Stocks, T-Bonds, US Dollar.
B. 9/28 AC – Jupiter 45 Uranus. Moderate change in trend Cattle, Copper, Cotton, Oats.
C. 9/29 AC – Moon’s North Node Contra-Parallel US Saturn. Major change in trend US Stocks, T-Bonds, US Dollar.
D. 9/30 AC – Jupiter 45 US Moon. Moderate change in trend US Stocks, T-Bonds, US Dollar.
E. 9/30 AC – Mercury in Virgo turns Direct. Major change in trend Corn, Oats, SOYBEANS, Wheat.
F. 9/30 AC – Mercury 0 North Latitude. Major change in trend Corn, Oats, Soybeans, Wheat.
G. 10/03AC – Saturn Parallel US Moon. Major change in trend US Stocks, T-Bonds, US Dollar.
Market Math
9/30 = 5,468 (Music) days > 10/11/2007 MAJOR HIGH.
Fibonacci – 9/23, 9/27
*DJIA – 9/27
*NYSE – 9/26
Astro – 9/26, 9/27, *9/30 AC.
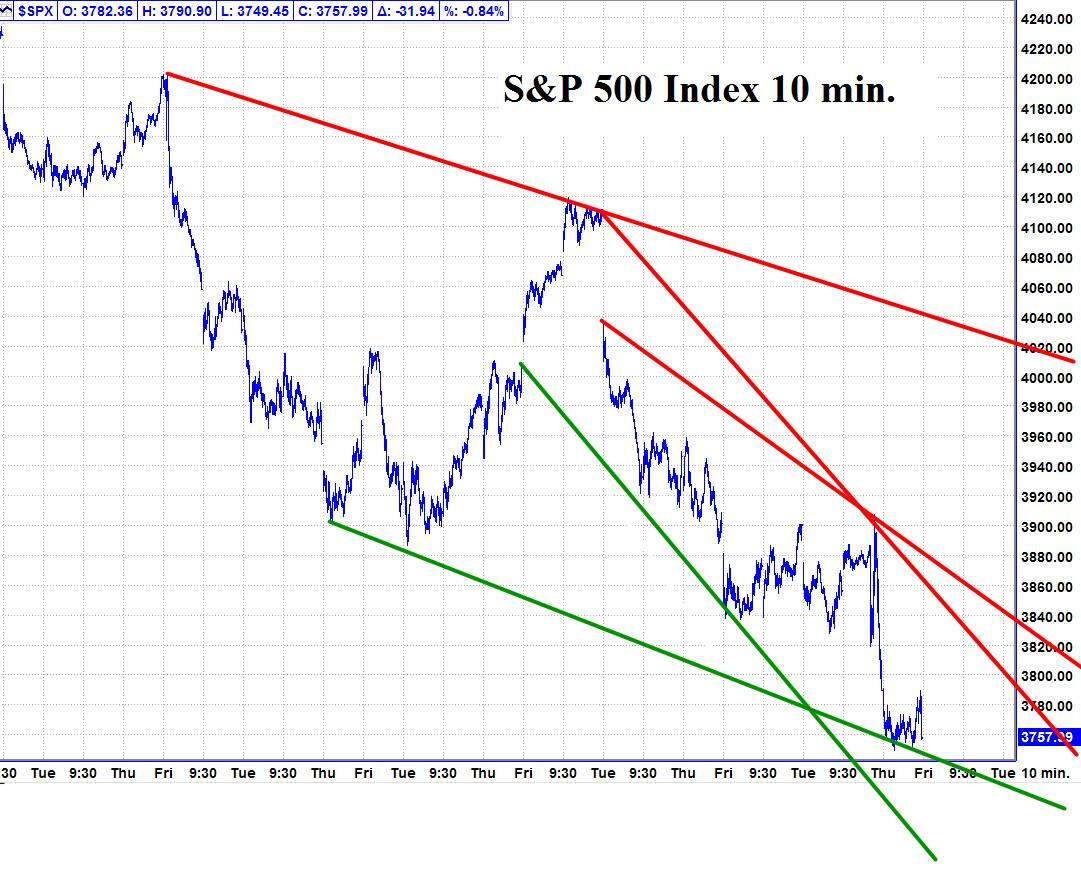
Please see below the S&P 500 10 minute chart.
Support - 3730 Resistance – 3840.
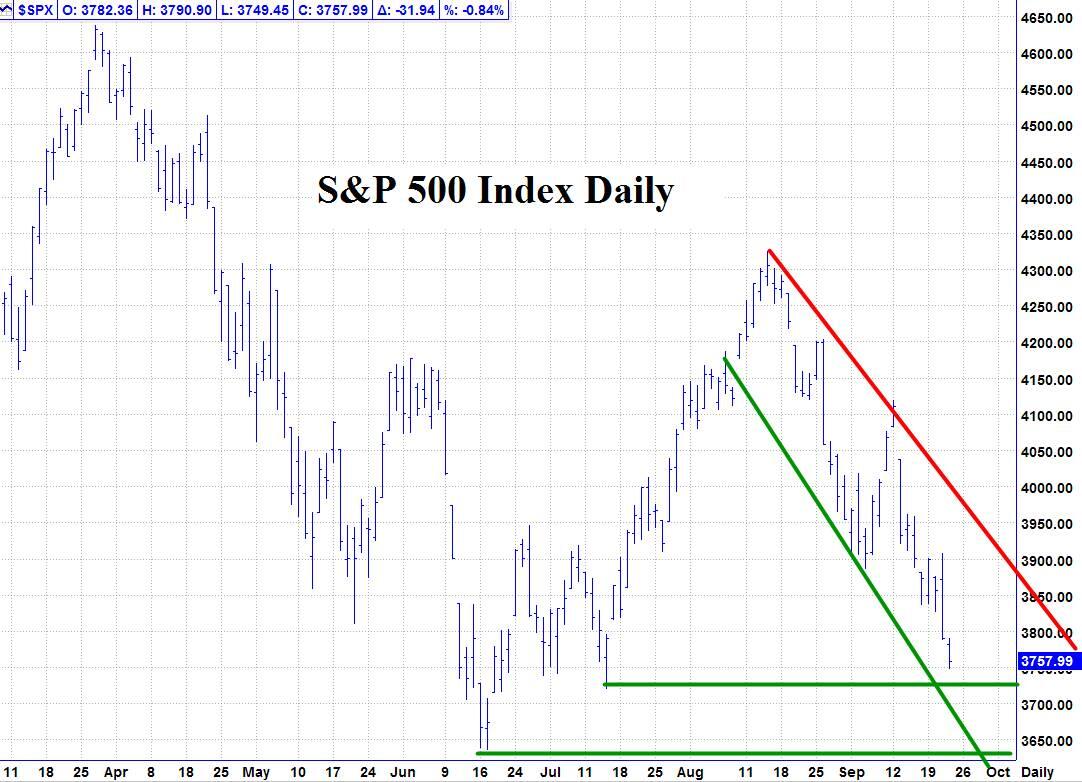
Please see below the S&P 500 Daily chart.
Support - 3730 Resistance – 3840.
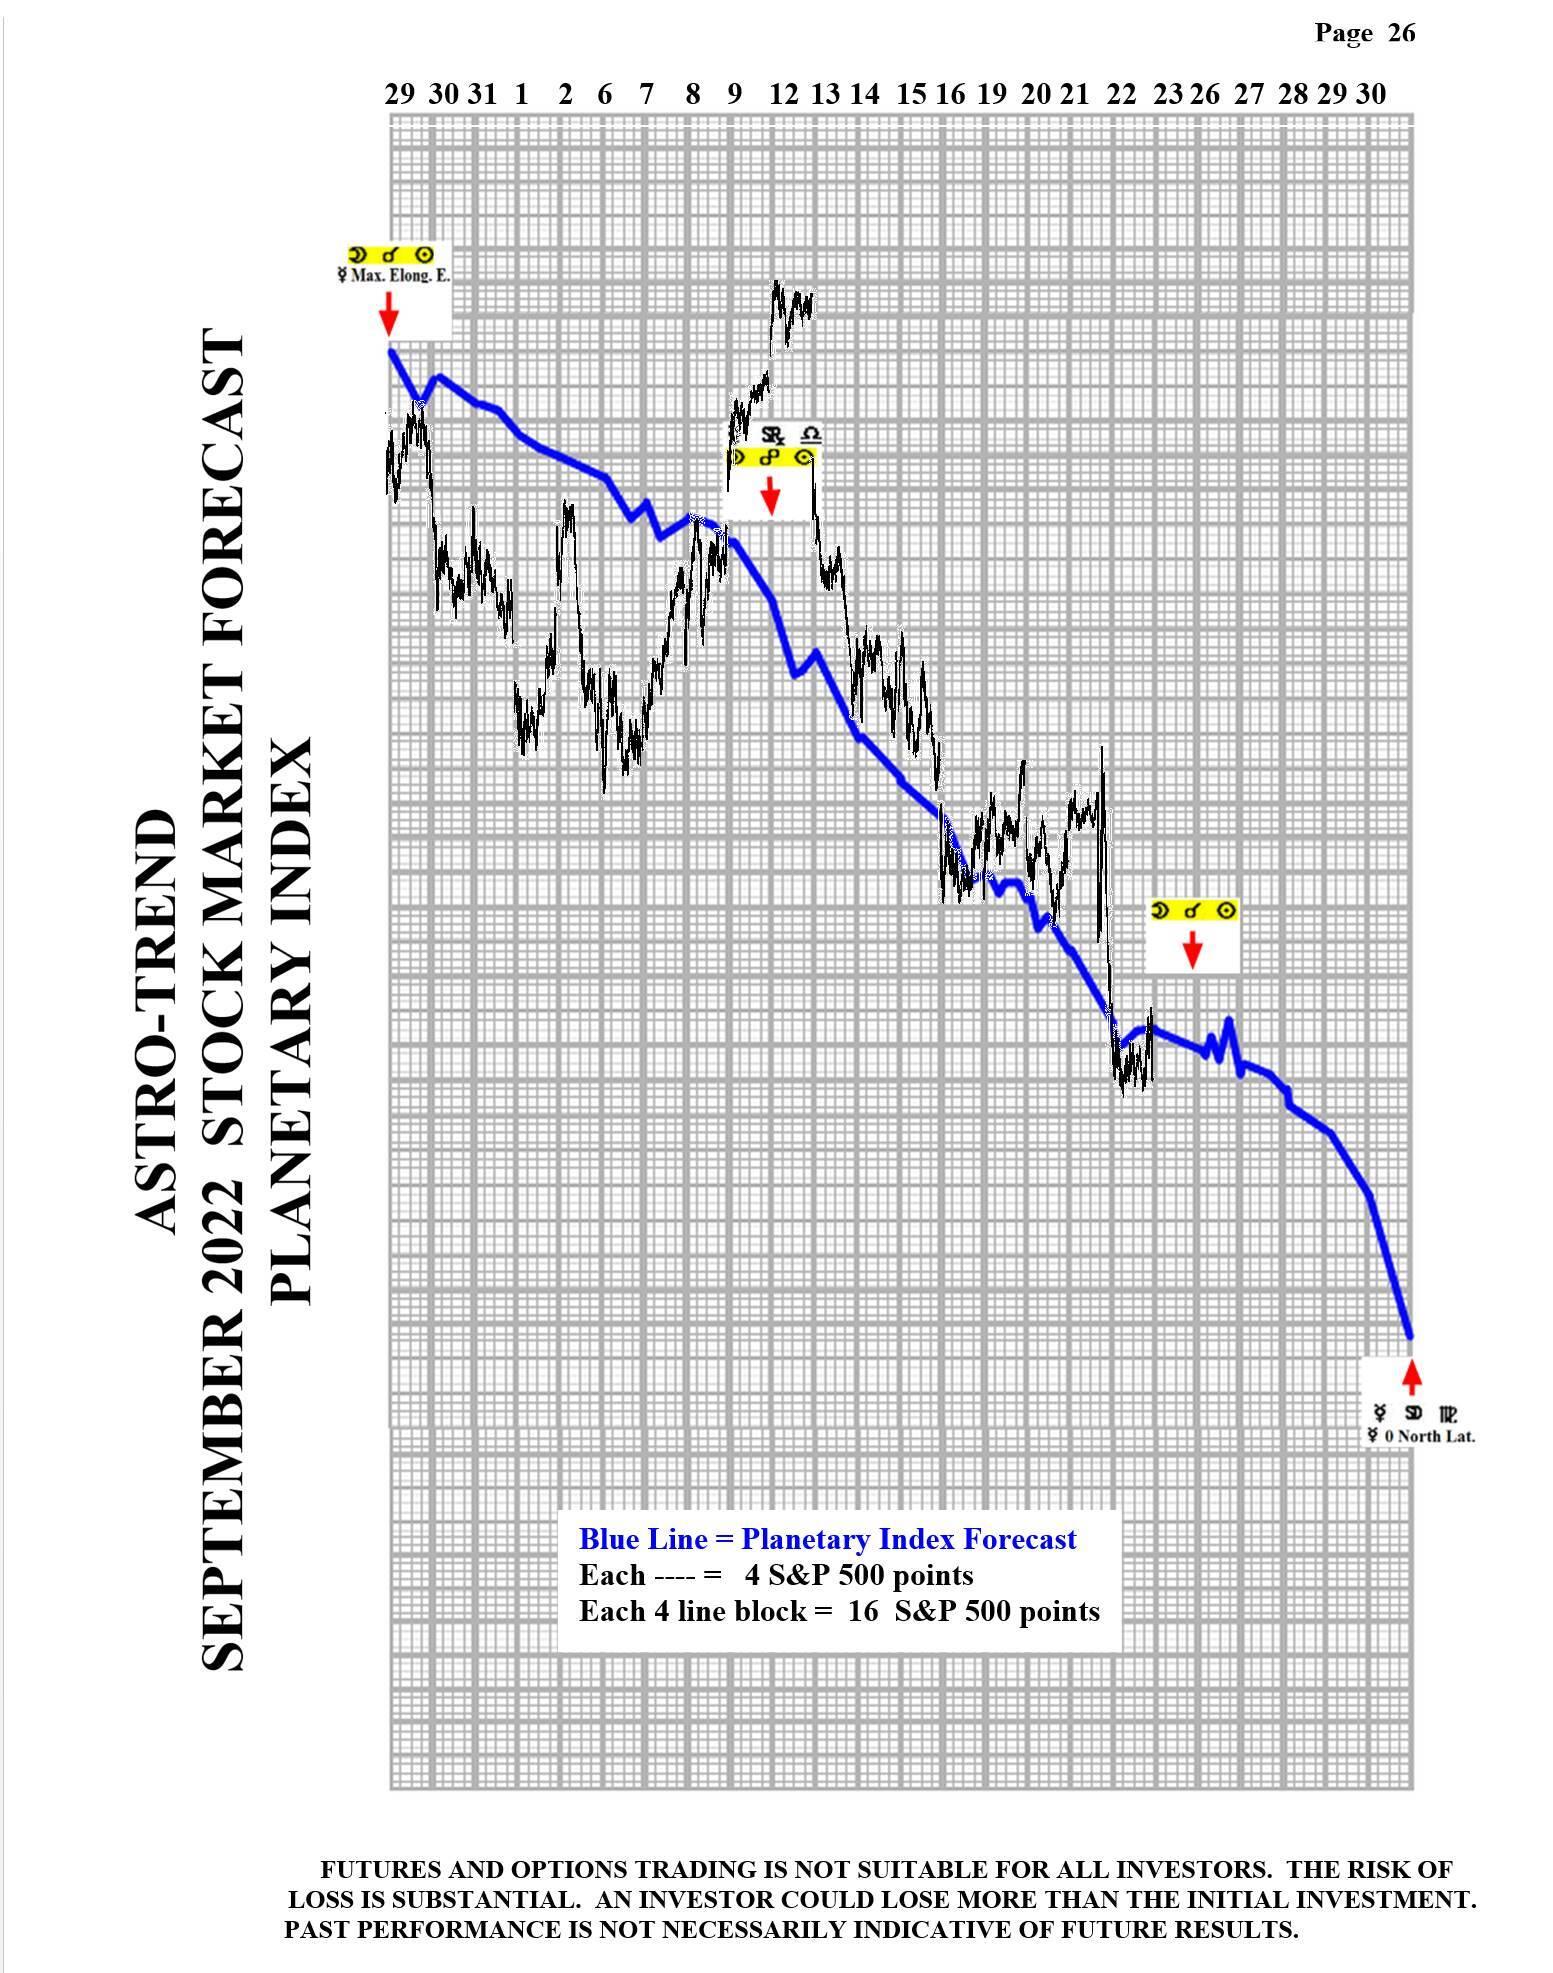
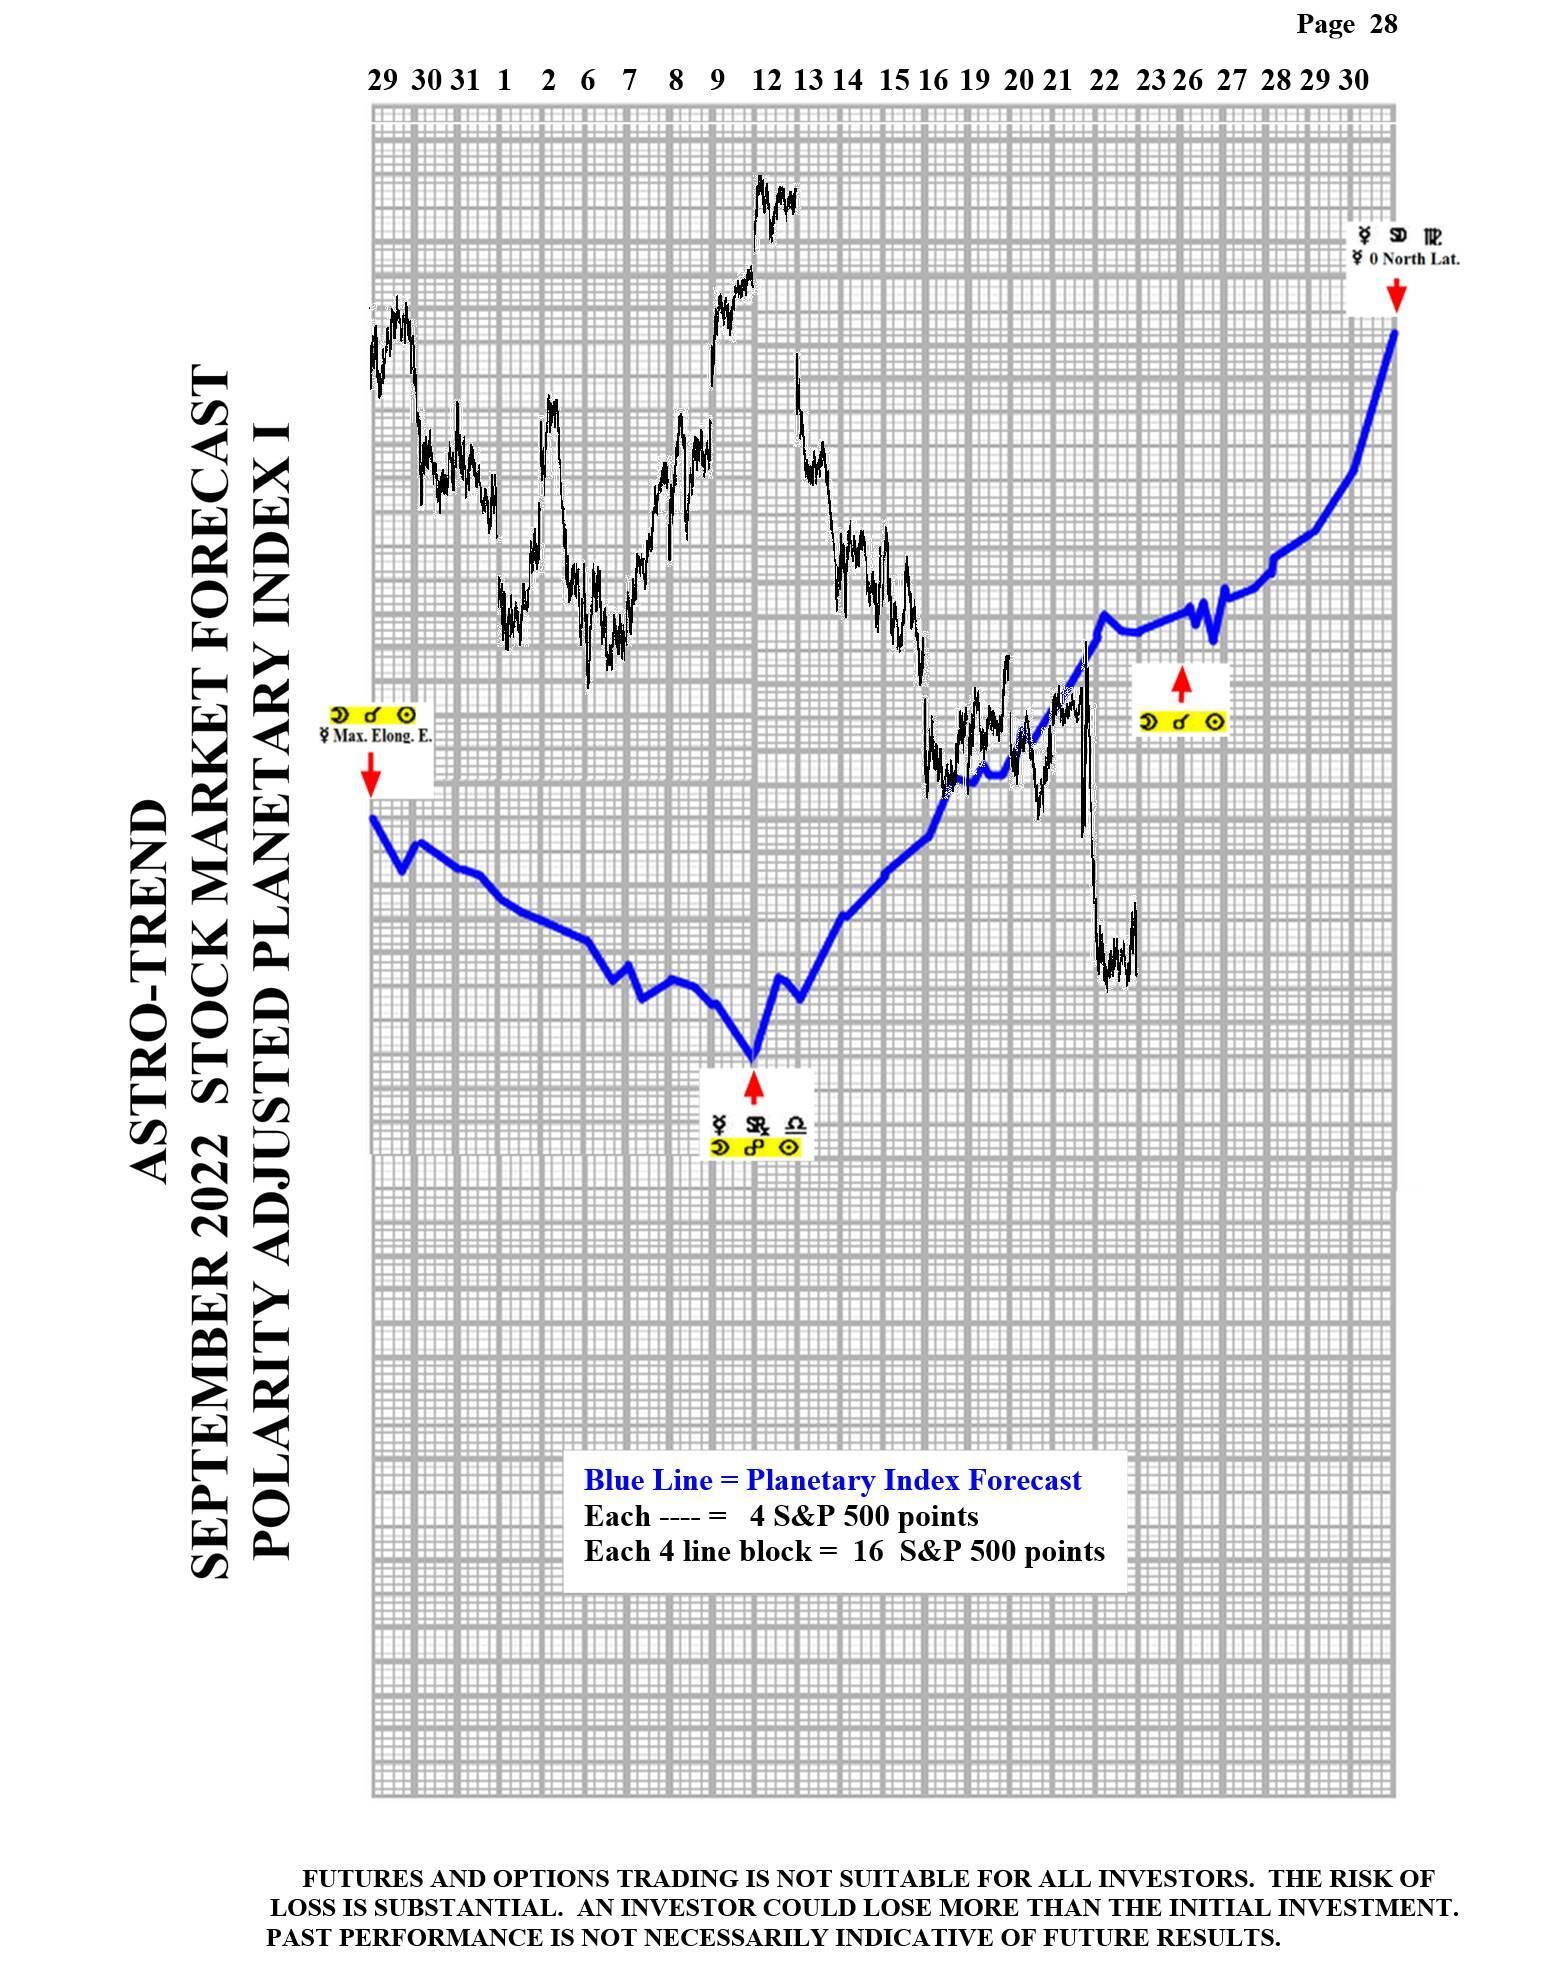
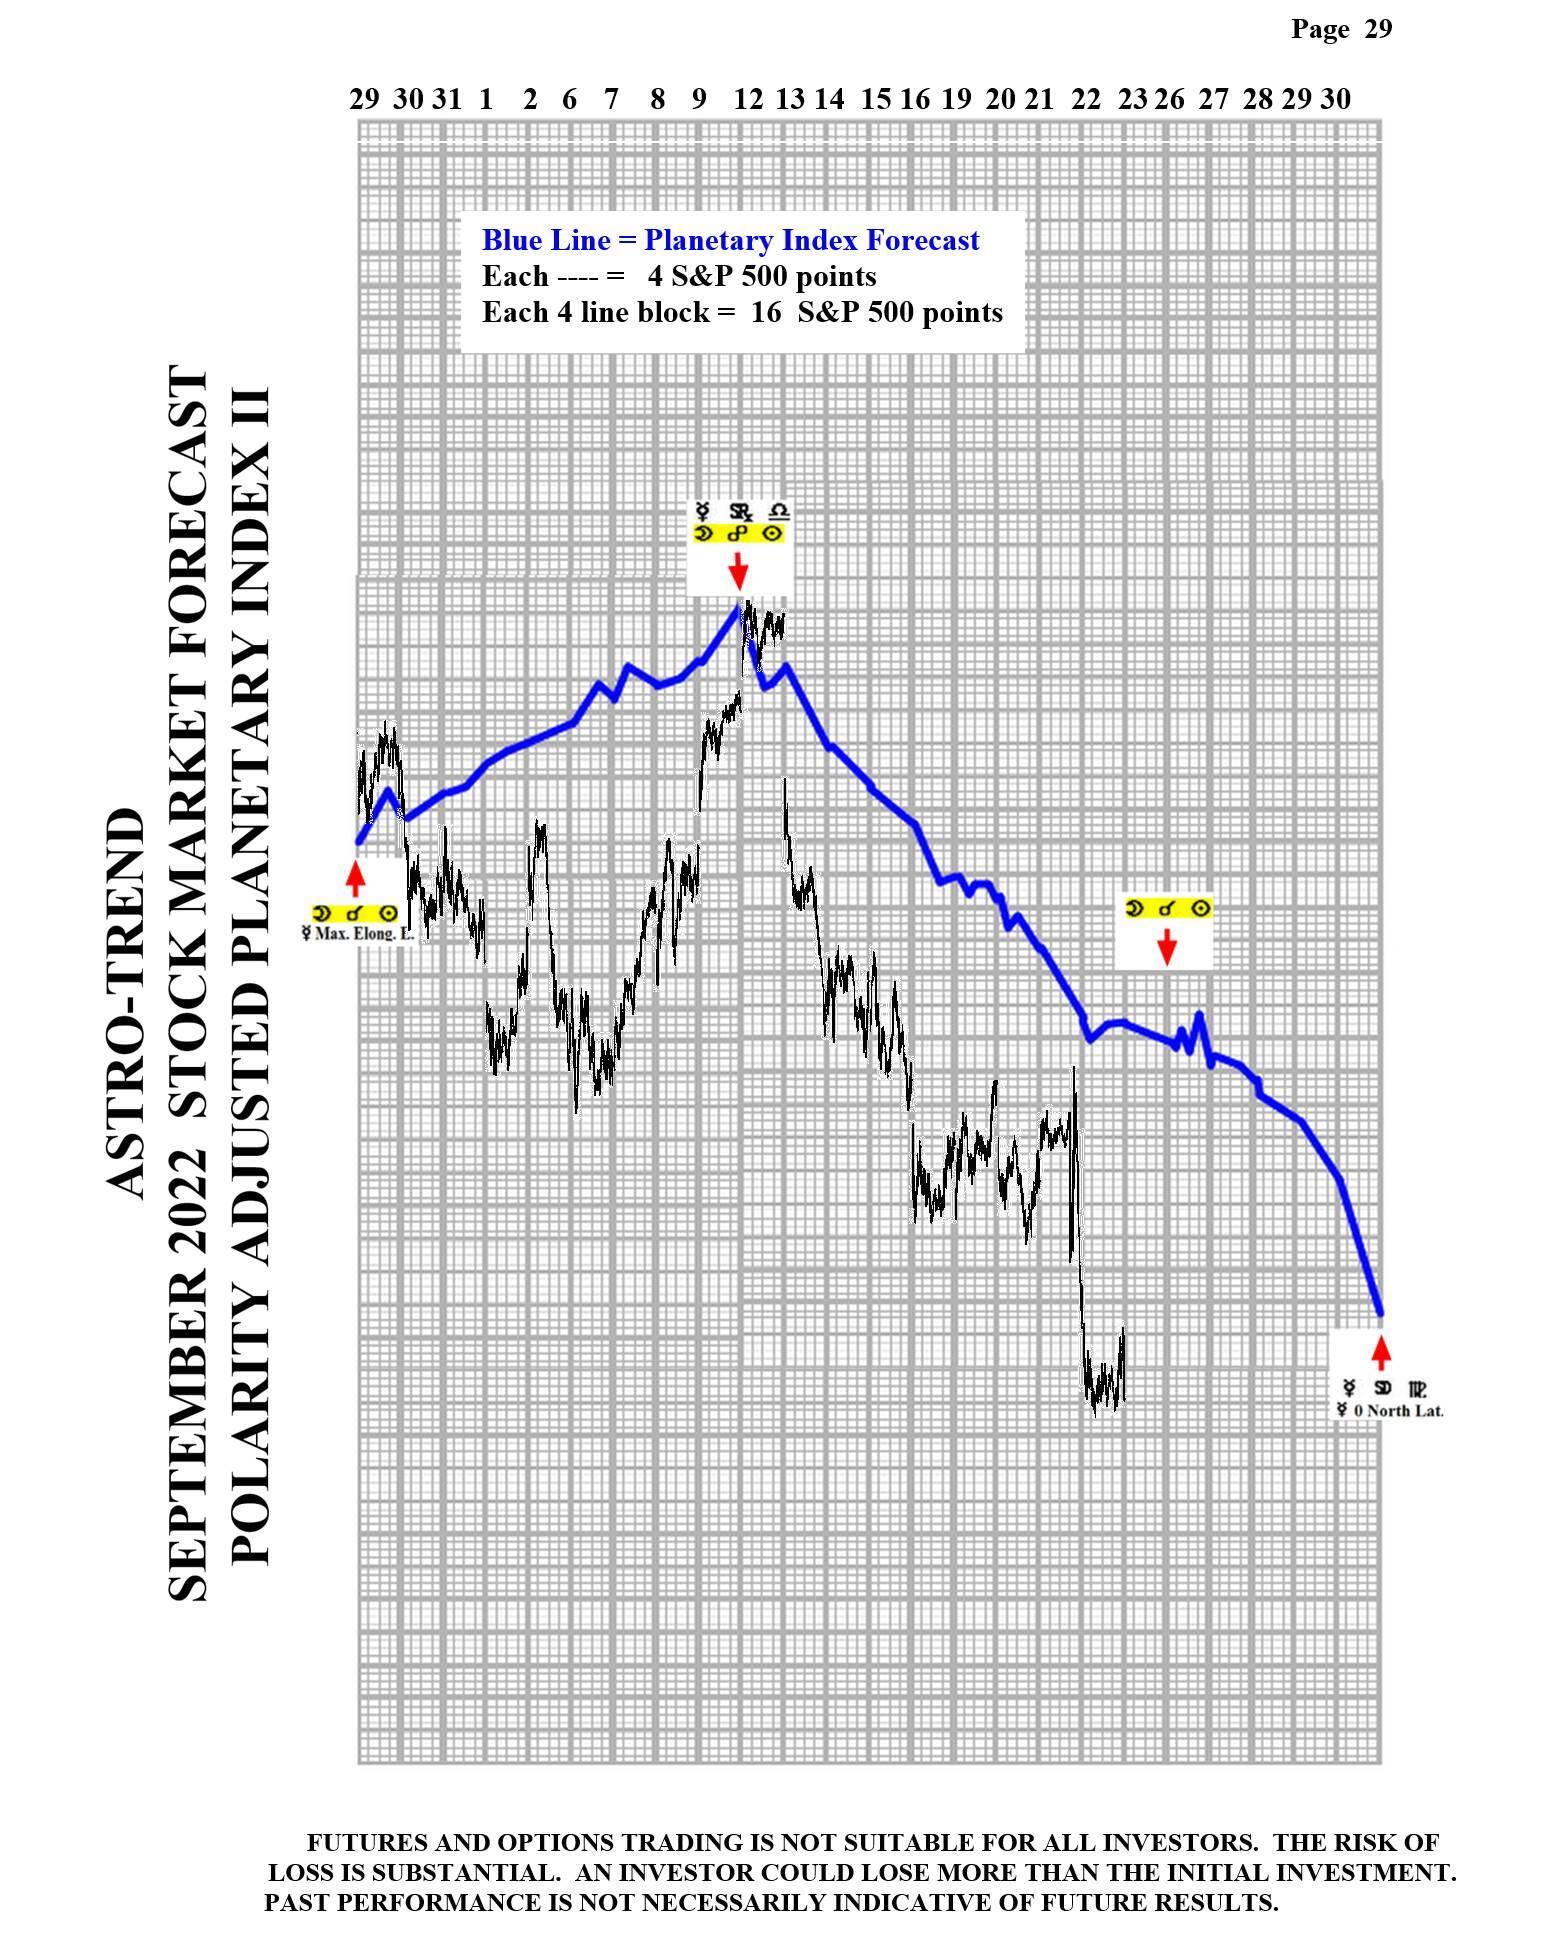
Please see below the September Planetary Index charts with S&P 500 10 minute bars for results.

Author

Norm Winski
Independent Analyst
www.astro-trend.com


