Recap 5/24 – Tuesday, the S&P gapped open down 32 handles and then declined another 68 handles into a 10:51 AM low of the day. From that low, the S&P rallied 55 handles into a 12:16 PM high. From that high, the S&P declined 37 handles into a 1:04 PM low. From that low, the S&P zig zagged 63 handles into a 3:39 PM high of the day. From that high the S&P declined about 20 handles into the close. 

S&P 500

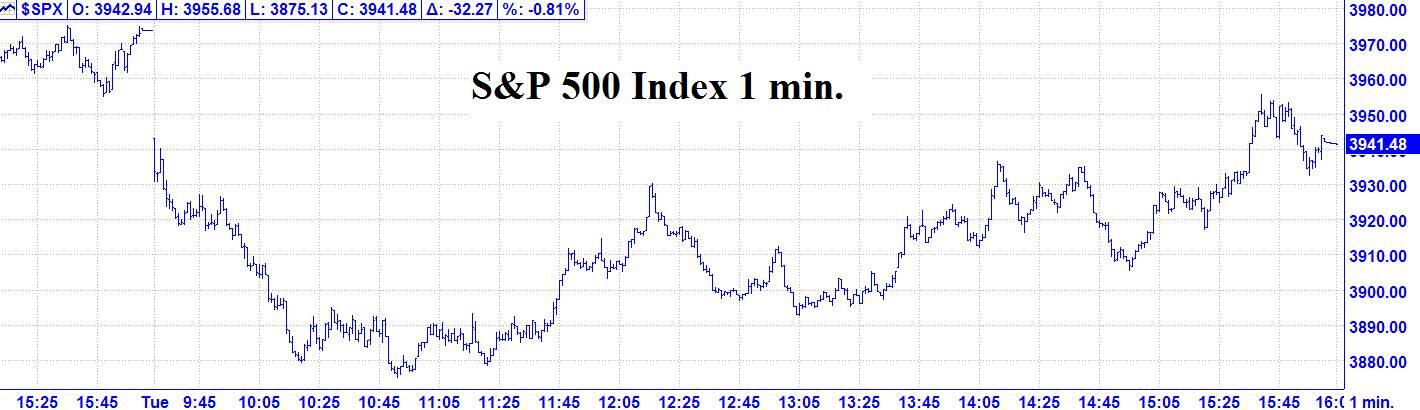
5/24 –  The major indices, had a large gap open and then traded lower into a mid-morning low of the day. From that low, the DJIA managed to recover its losses and close with a small gain. The S&P and Nasdaq did not fare as well per the following closes; DJIA + 48.38; S&P 500 - 32.27; and the Nasdaq Composite - 270.83.                

Looking ahead  - We were looking for a Monday high.  We didn’t see any positive results for this until after Monday’s close, when the Emini gapped down for the evening session. The weakness continued into mid-morning on Tuesday.  From Monday’s high to Tuesday’s low, there was more than a 100 handle decline. The next change in trend point is 5/24 AC when Geo Mars changes signs by entering Aries.  Please see details below.

The Now Index is now in the NEUTRAL ZONE.

Coming events

(Stocks potentially respond to all events).                   

3.   B. 5/24 AC –  Geo Mars enters Aries.  Important change in trend Corn, Gold, OJ, Silver, Sugar, Wheat.

C. 5/27 AC – Mercury Aphelion.  Major change in trend Corn, Oats, Soybeans, Wheat.

D. 5/27 AC – Jupiter 45 US Moon.  Moderate change in trend US Stocks, T-Bonds, US Dollar.

E. 5/27 AC – Jupiter Parallel Latitude Neptune.  Major change in trend Commodity Index, Oats, Oil.

F. 5/27 AC– Helio Saturn Contra-Parallel Uranus.  Major change in trend Cattle, Coffee, Copper, Cotton.

D. 5/27 AC – New Moon in Gemini.  Major change in trend Financials, Grains, Precious Metals.

Stock market key dates

5/28 (Sat.) = 8,100 (90^2) days > 3/24/2000 MAJOR TOP.

Fibonacci – 5/28.

Astro –   *5/27*.

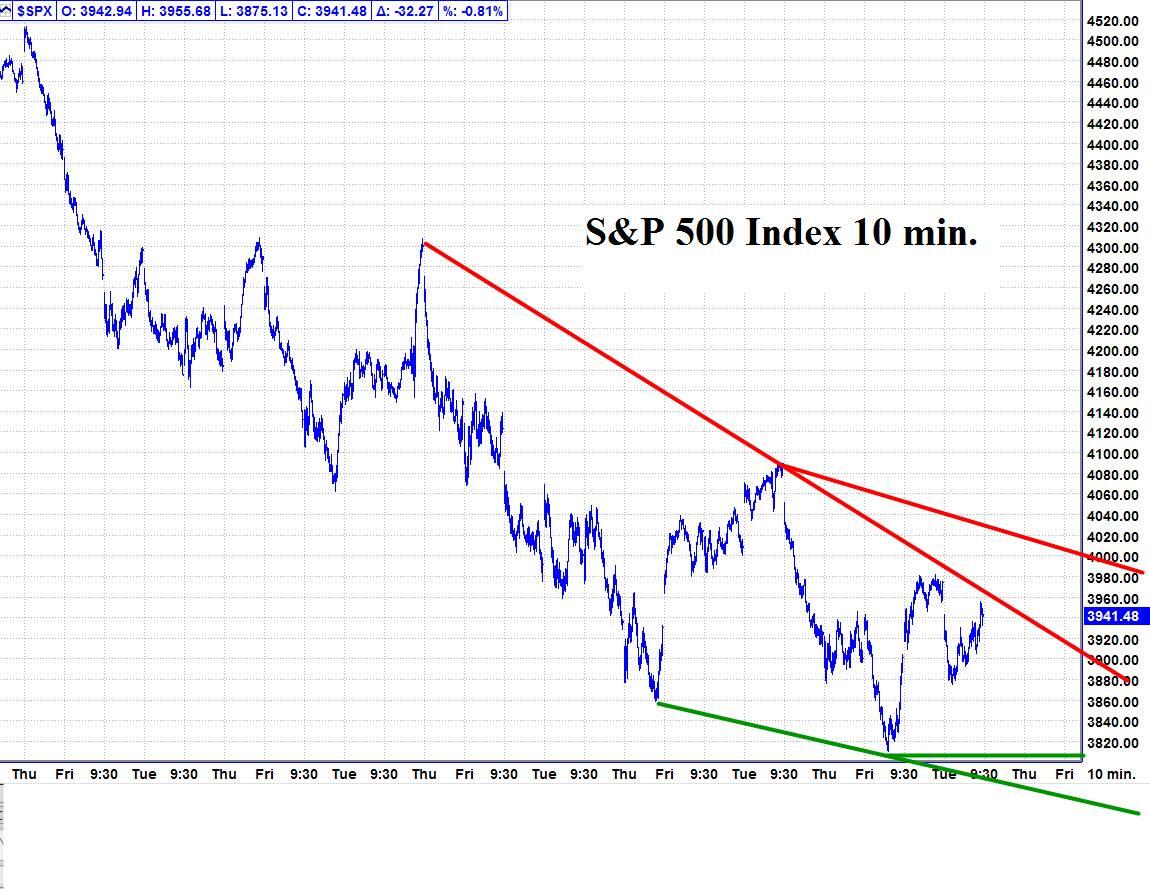
Please see below the S&P 500 10 minute chart.

Support  - 3810, 3790   Resistance – 3960, 4020.

Chart

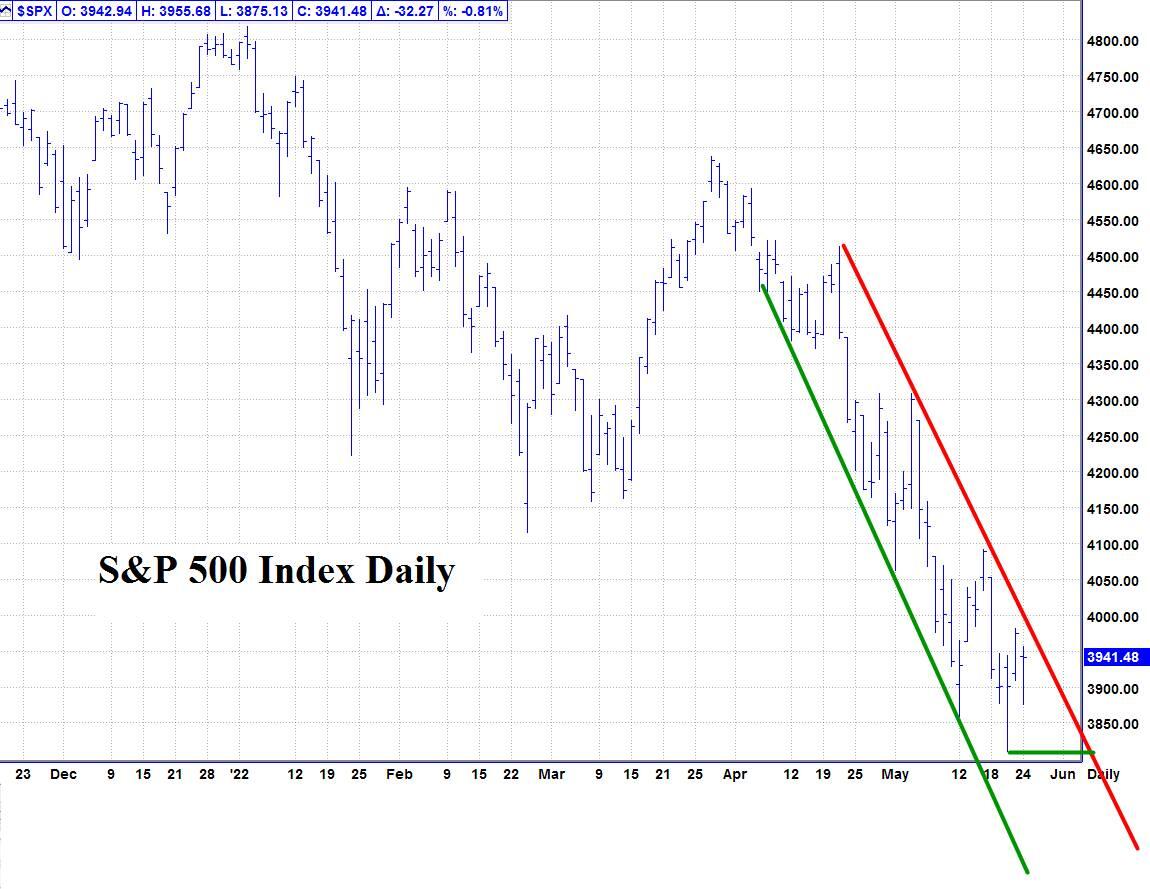
Please see below the S&P 500 Daily chart.                                            

Support  - 3810, 3790   Resistance – 3960, 4020.

Chart

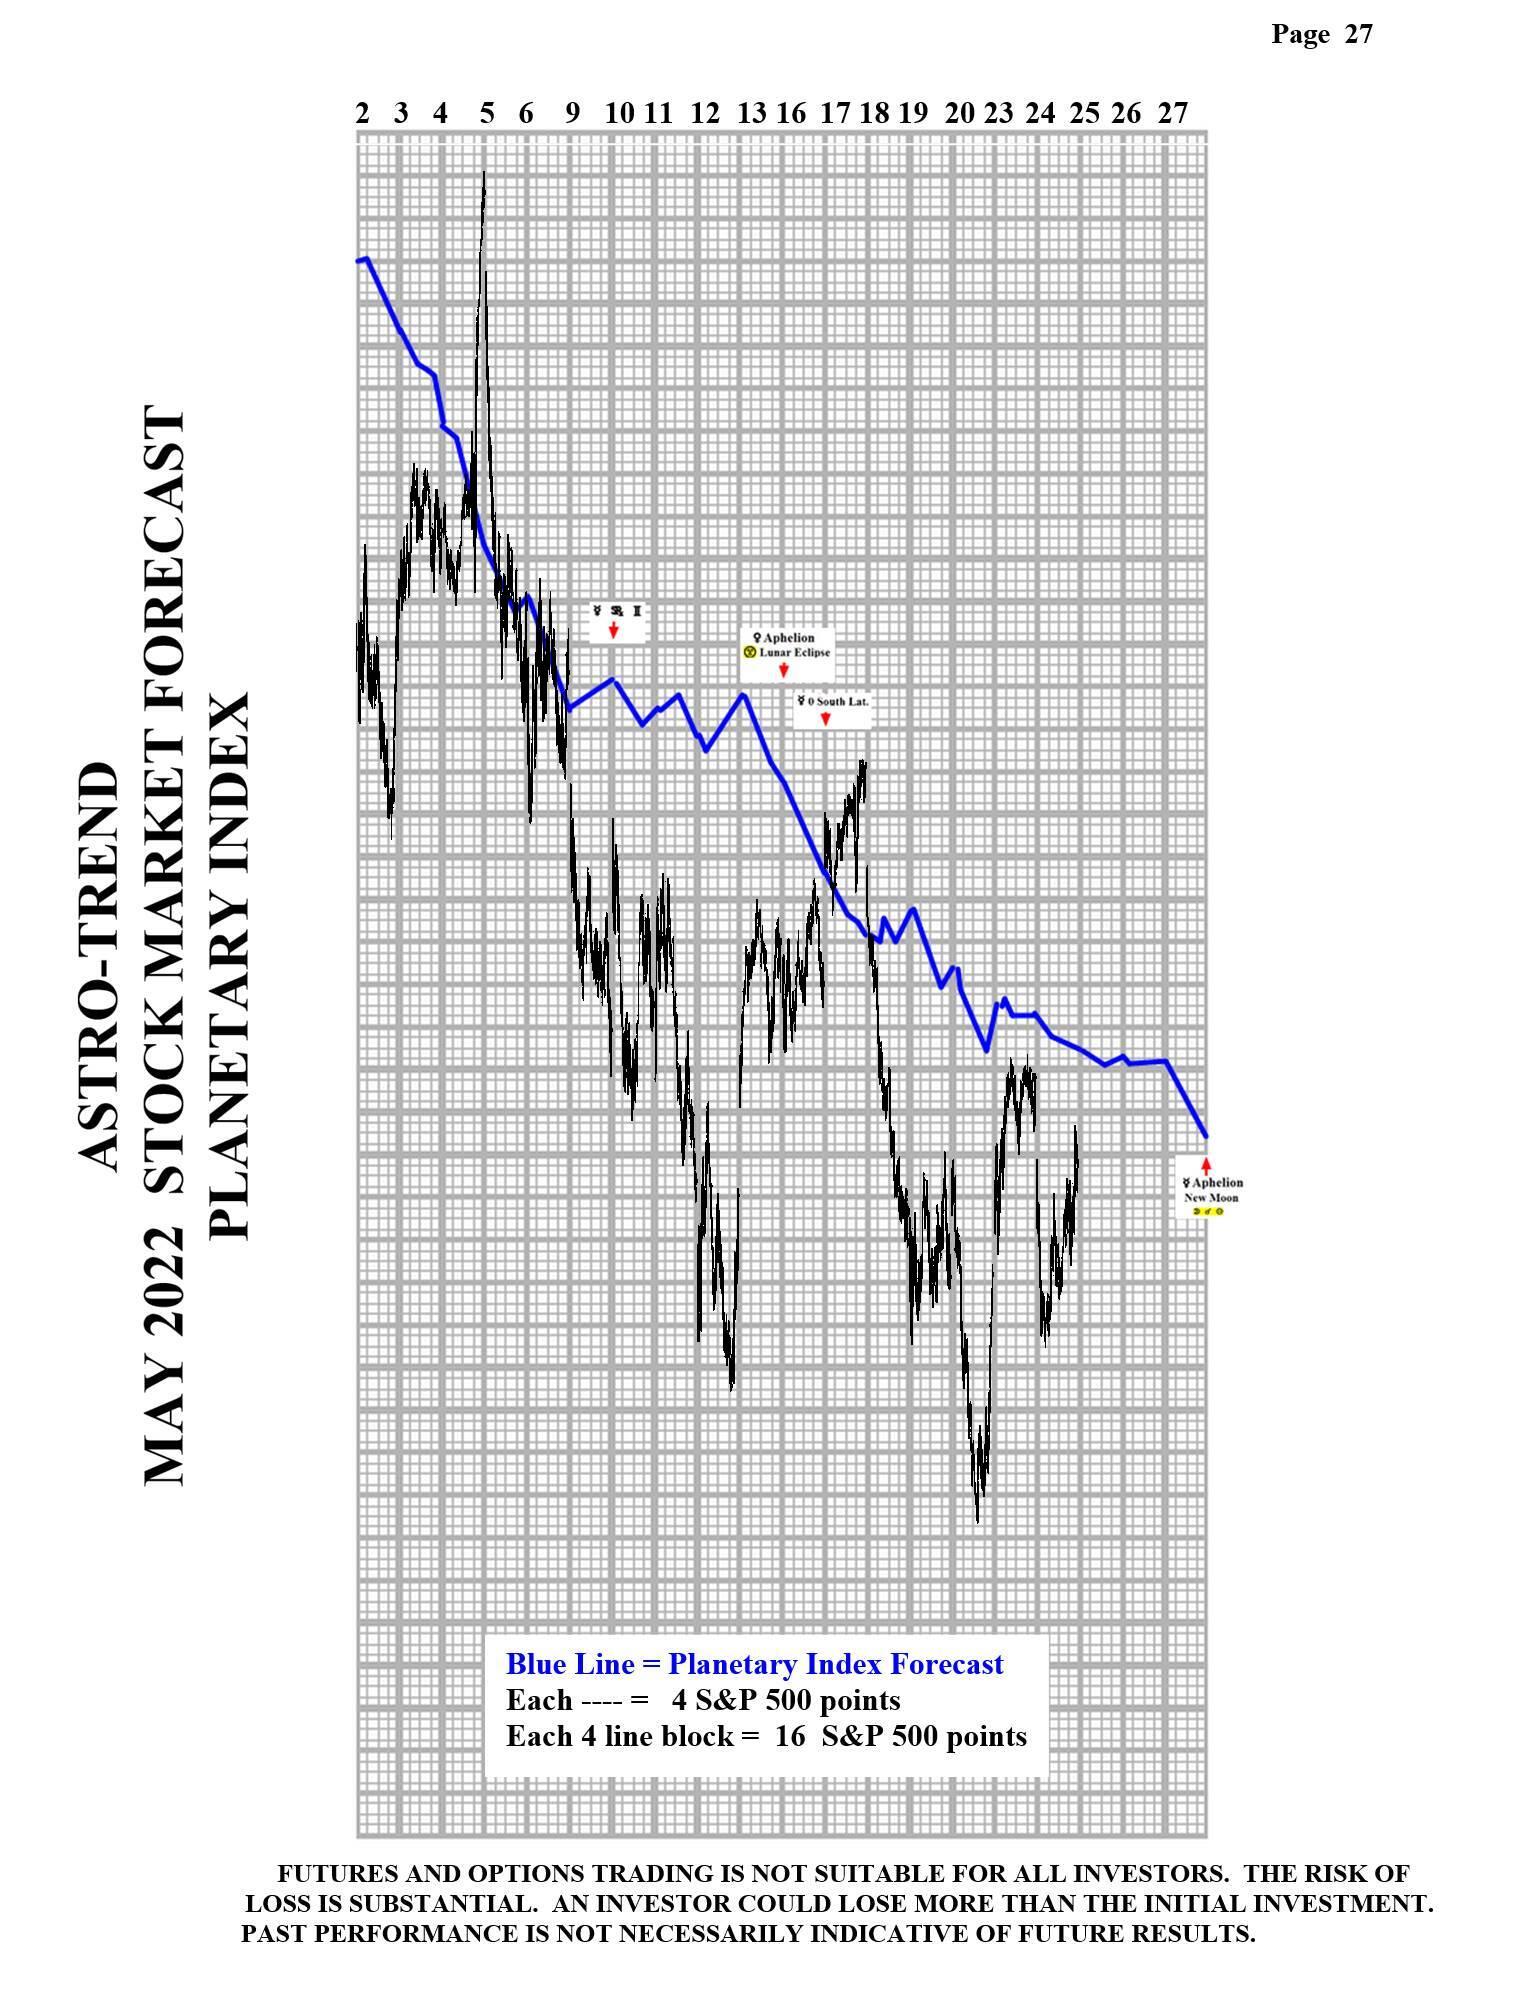
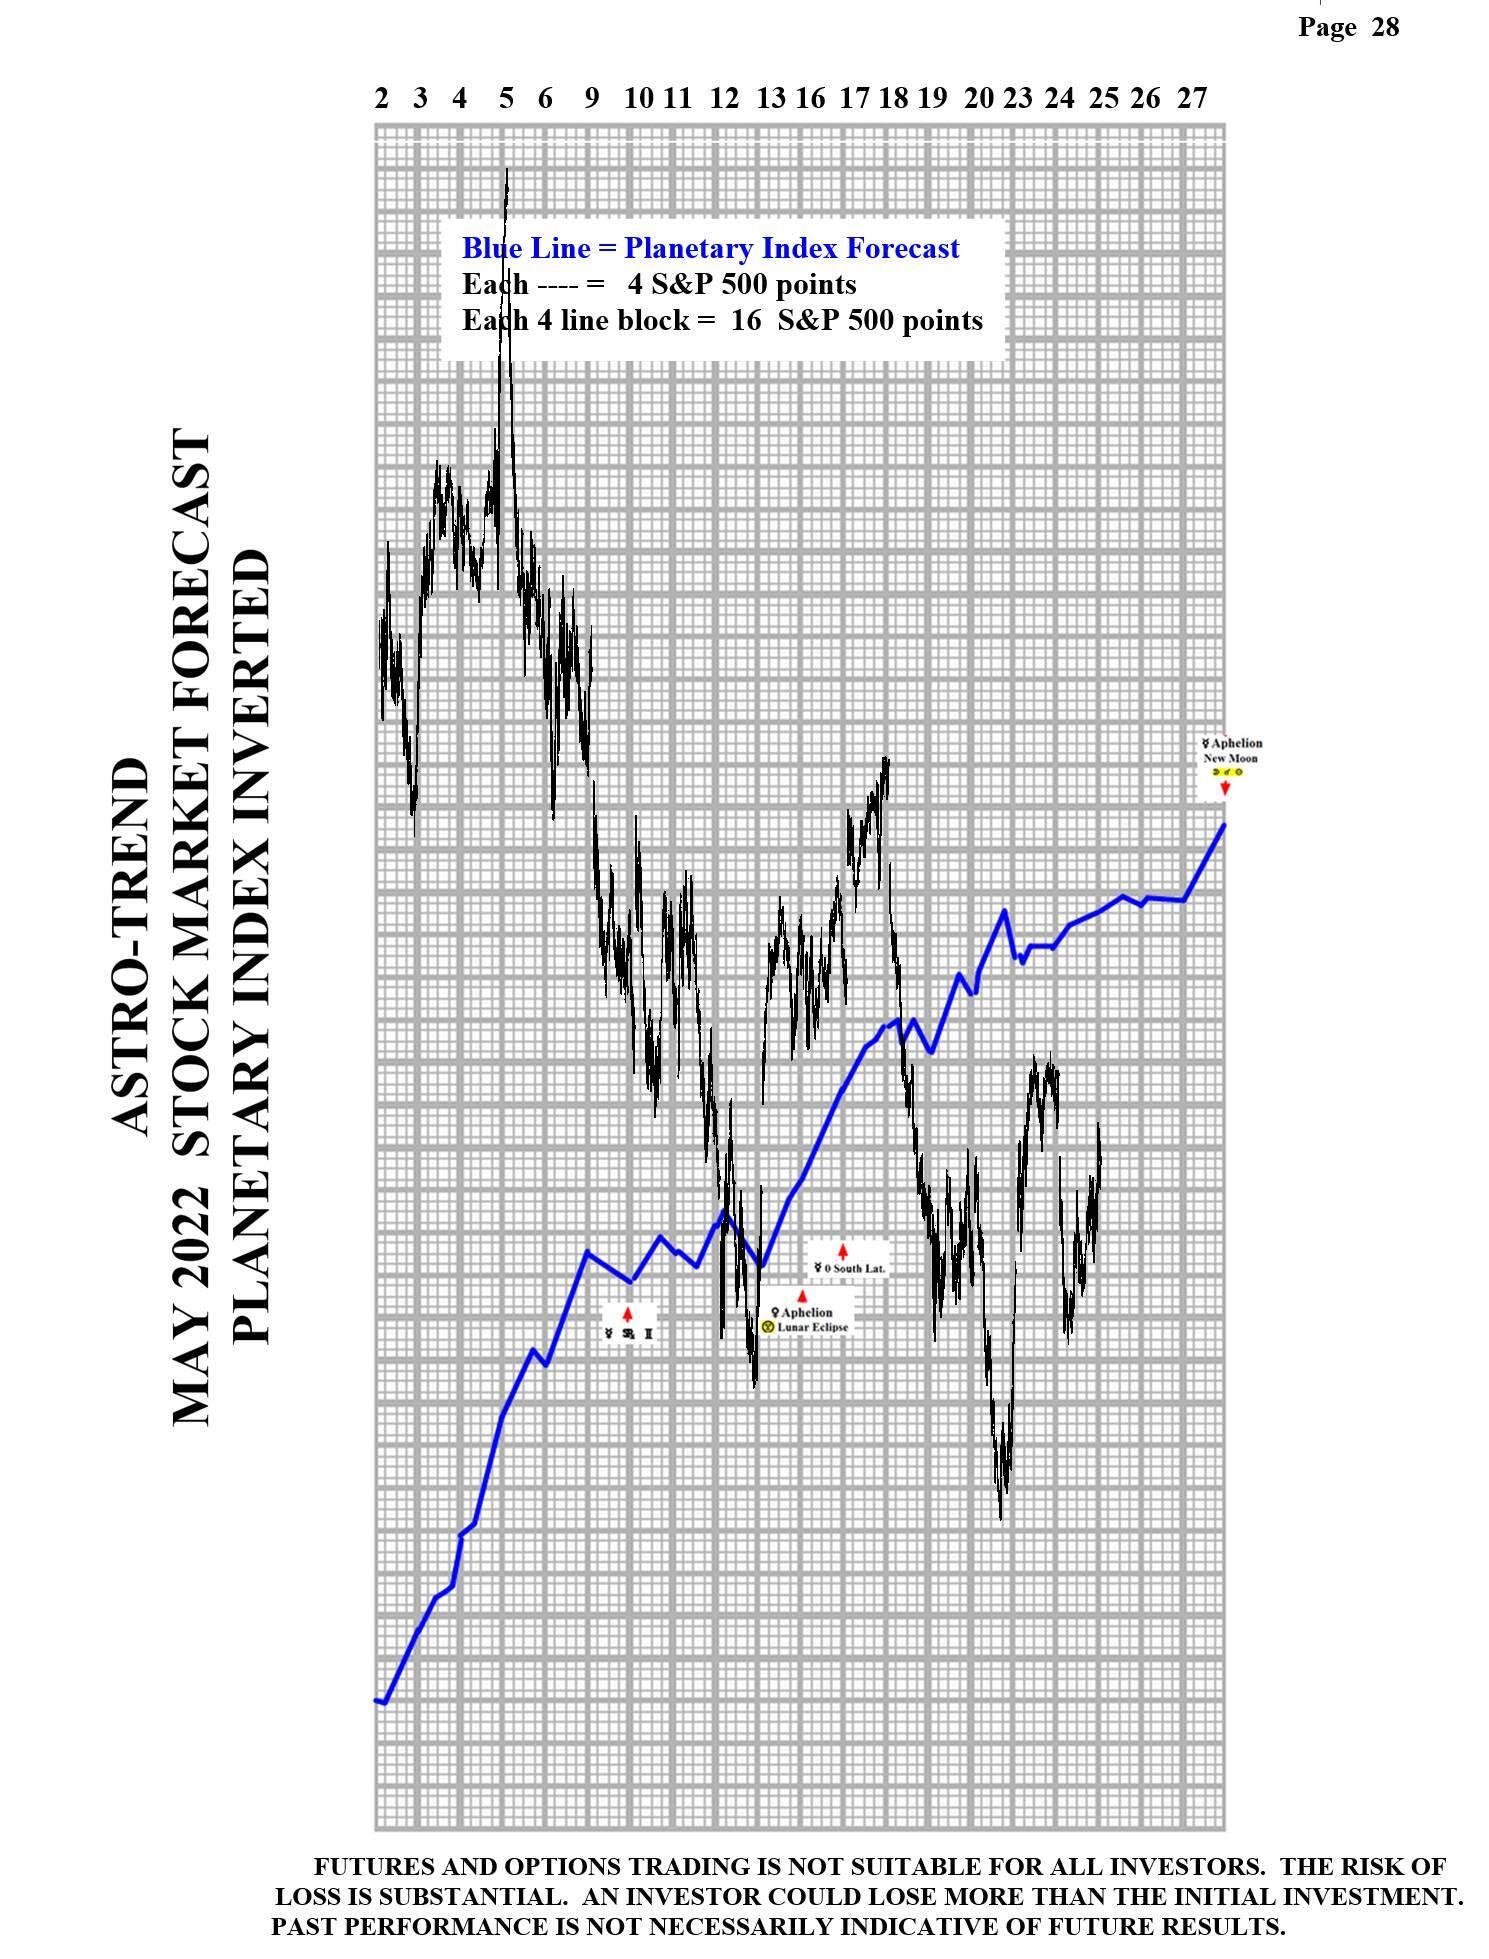
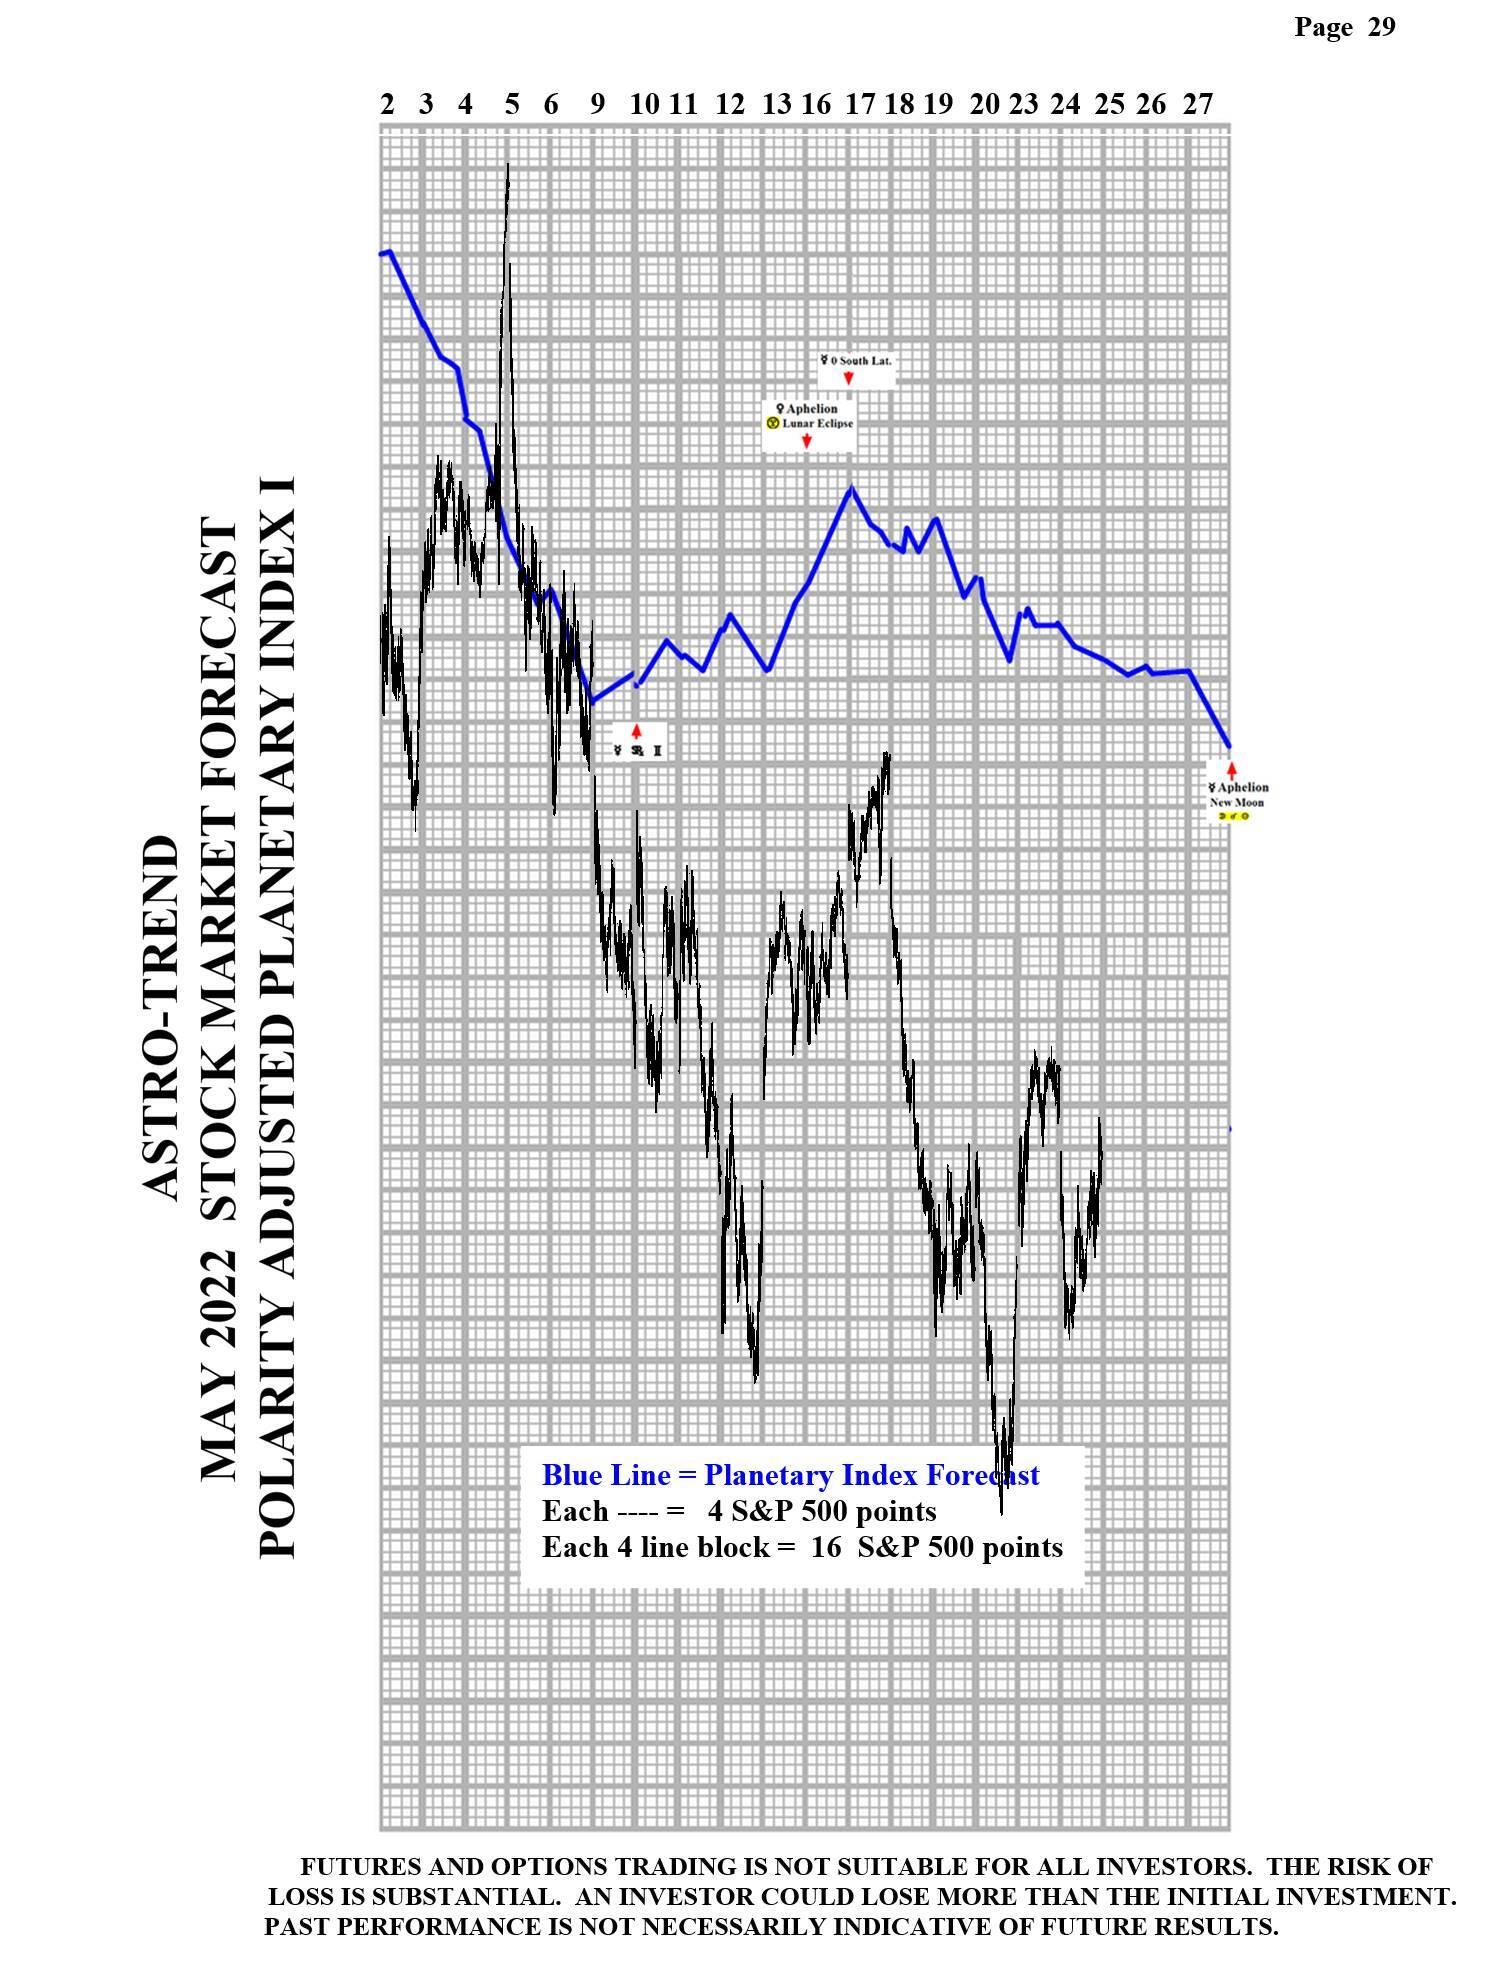
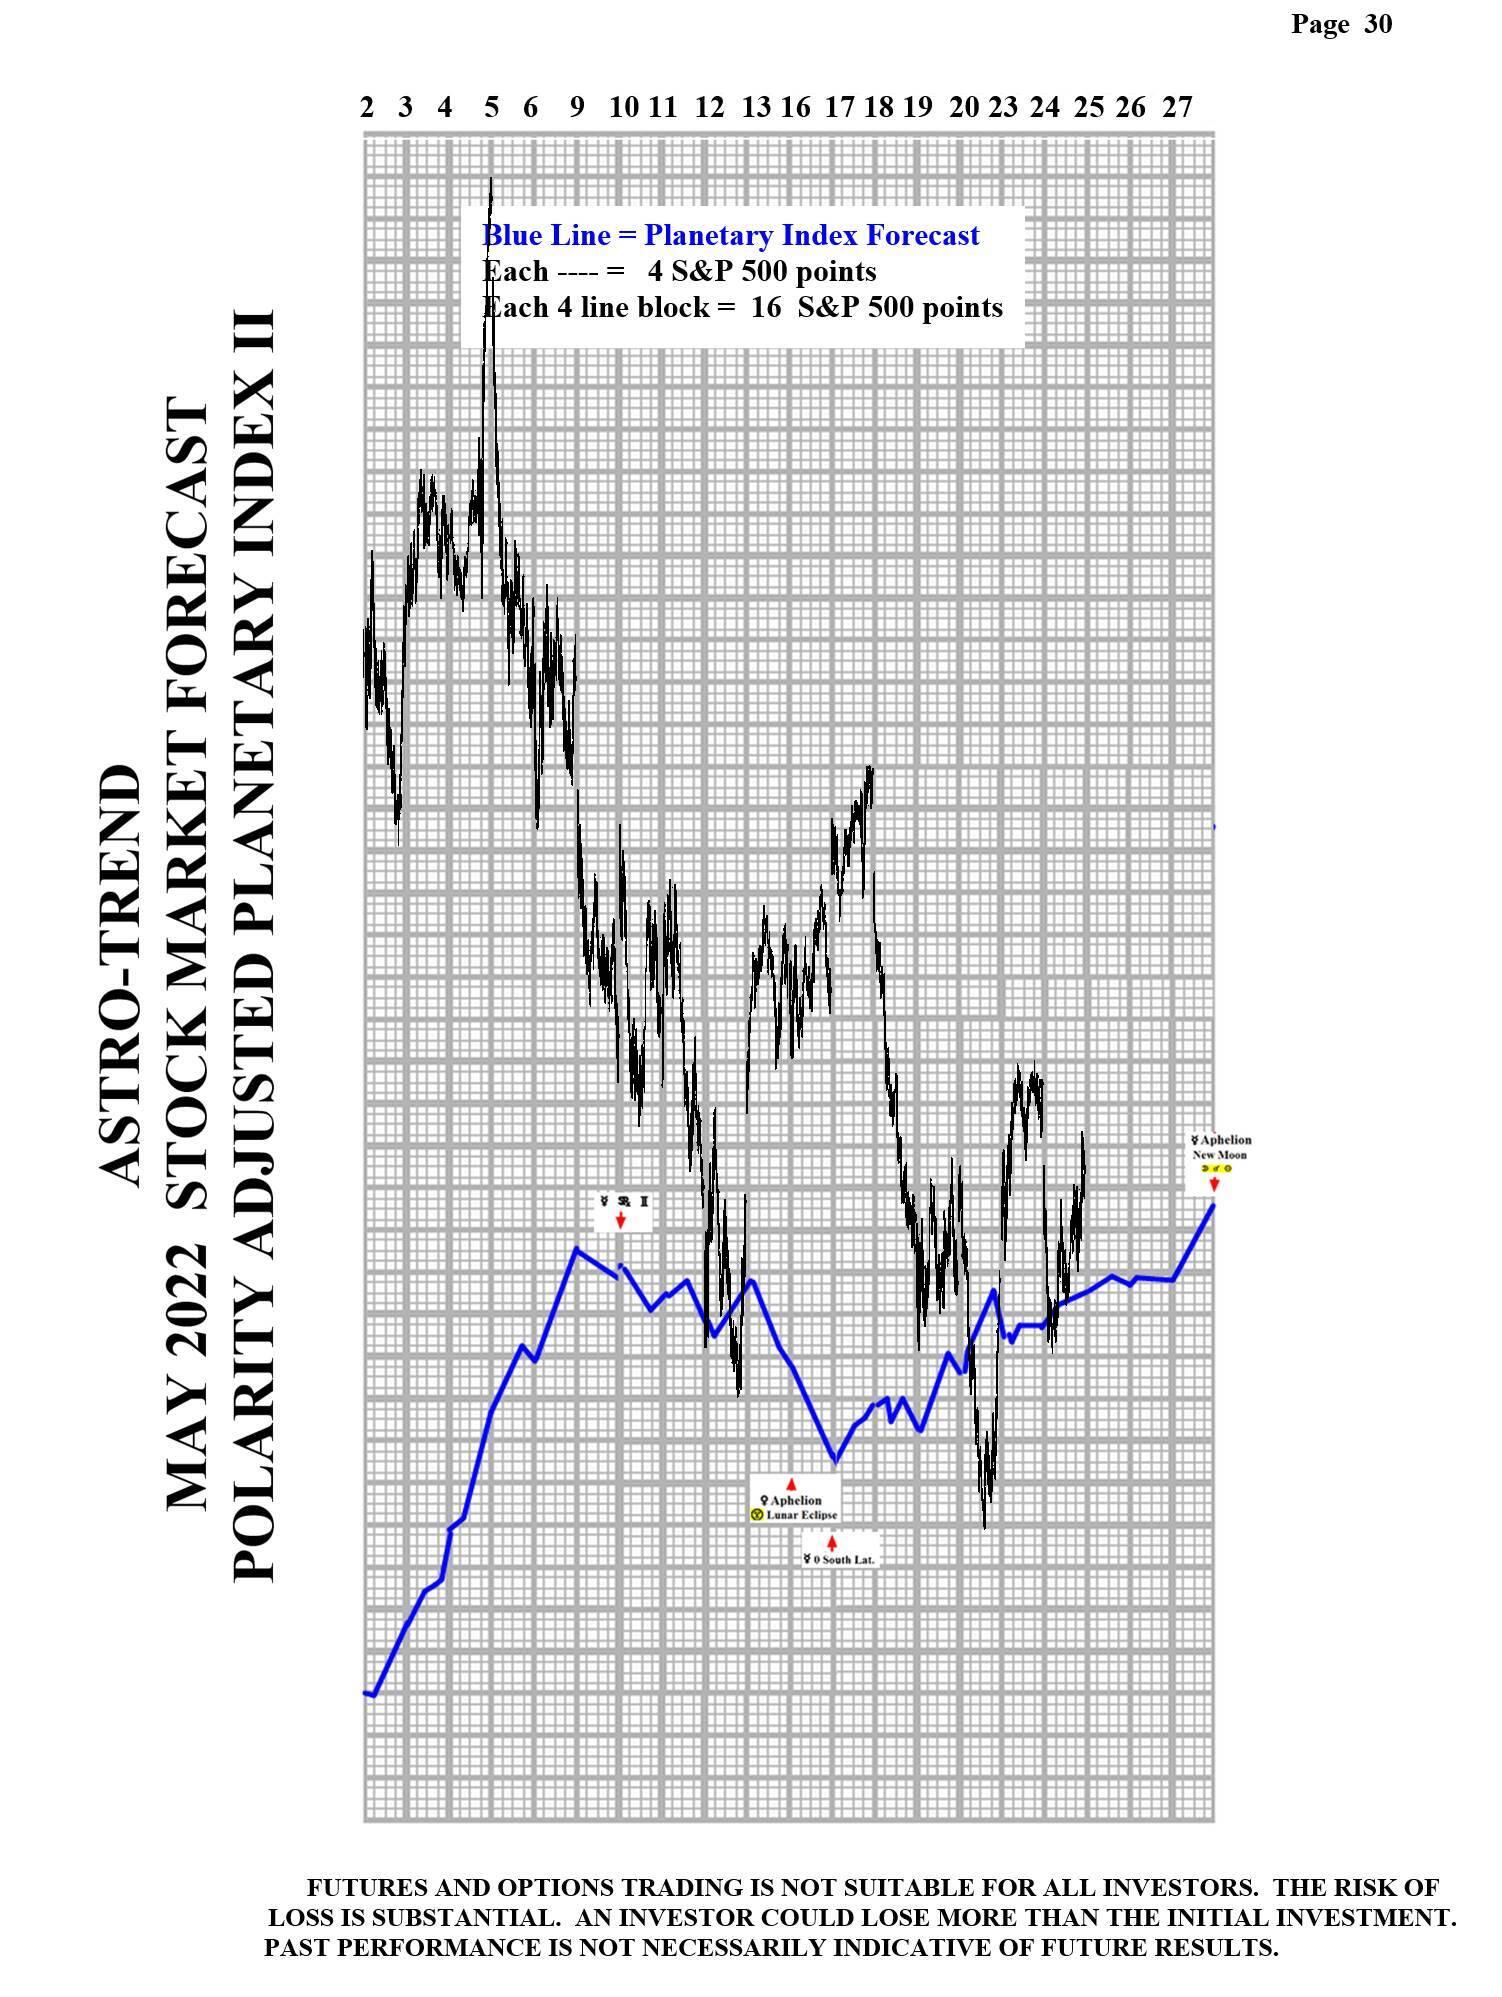
Please see below the May Planetary Index chart with S&P 500 10 minute bars for results.

Chart

Chart

Chart

Chart

Note: All information on this page is subject to change. The use of this website constitutes acceptance of our user agreement. Please read our privacy policy and legal disclaimer. Opinions expressed at FXstreet.com are those of the individual authors and do not necessarily represent the opinion of FXstreet.com or its management. Risk Disclosure: Trading foreign exchange on margin carries a high level of risk, and may not be suitable for all investors. The high degree of leverage can work against you as well as for you. Before deciding to invest in foreign exchange you should carefully consider your investment objectives, level of experience, and risk appetite. The possibility exists that you could sustain a loss of some or all of your initial investment and therefore you should not invest money that you cannot afford to lose. You should be aware of all the risks associated with foreign exchange trading, and seek advice from an independent financial advisor if you have any doubts.

Recommended Content


Recommended Content

Editors’ Picks

AUD/USD favours extra retracements in the short term

AUD/USD favours extra retracements in the short term

AUD/USD kept the negative stance well in place and briefly broke below the key 0.6400 support to clinch a new low for the year on the back of the strong dollar and mixed results from the Chinese docket.

AUD/USD News

EUR/USD now shifts its attention to 1.0500

EUR/USD now shifts its attention to 1.0500

The ongoing upward momentum of the Greenback prompted EUR/USD to lose more ground, hitting new lows for 2024 around 1.0600, driven by the significant divergence in monetary policy between the Fed and the ECB.

EUR/USD News

Gold aiming to re-conquer the $2,400 level

Gold aiming to re-conquer the $2,400 level

Gold stages a correction on Tuesday and fluctuates in negative territory near $2,370 following Monday's upsurge. The benchmark 10-year US Treasury bond yield continues to push higher above 4.6% and makes it difficult for XAU/USD to gain traction.

Gold News

Bitcoin price defends $60K as whales hold onto their BTC despite market dip

Bitcoin price defends $60K as whales hold onto their BTC despite market dip

Bitcoin (BTC) price still has traders and investors at the edge of their seats as it slides further away from its all-time high (ATH) of $73,777. Some call it a shakeout meant to dispel the weak hands, while others see it as a buying opportunity.

Read more

Friday's Silver selloff may have actually been great news for silver bulls!

Friday's Silver selloff may have actually been great news for silver bulls!

Silver endured a significant selloff last Friday. Was this another step forward in the bull market? This may seem counterintuitive, but GoldMoney founder James Turk thinks it was a positive sign for silver bulls.

Read more

Majors

Cryptocurrencies

Signatures