The intraday AUD/USD spot price has been very consistent during Friday's prior trading sessions
-
The price of the Australian Dollar almost stabilized on Friday.
-
The Moving Average indicator maintains its bullish price signals.
-
The momentum oscillator, the Relative Strength Index, remains within its normal zone; rising momentum will confirm the continuation of the uptrend.

During today's European session, the AUD/USD pair traded inside a tight range. without making any significant breakthrough. Therefore, the difference between the day's high and low did not surpass 30 pips. At press time, the AUD/USD was trading at 0.6950, down 0.0020 or 0.29% for the intraday.
This analysis relies on a 4-hour timeframe
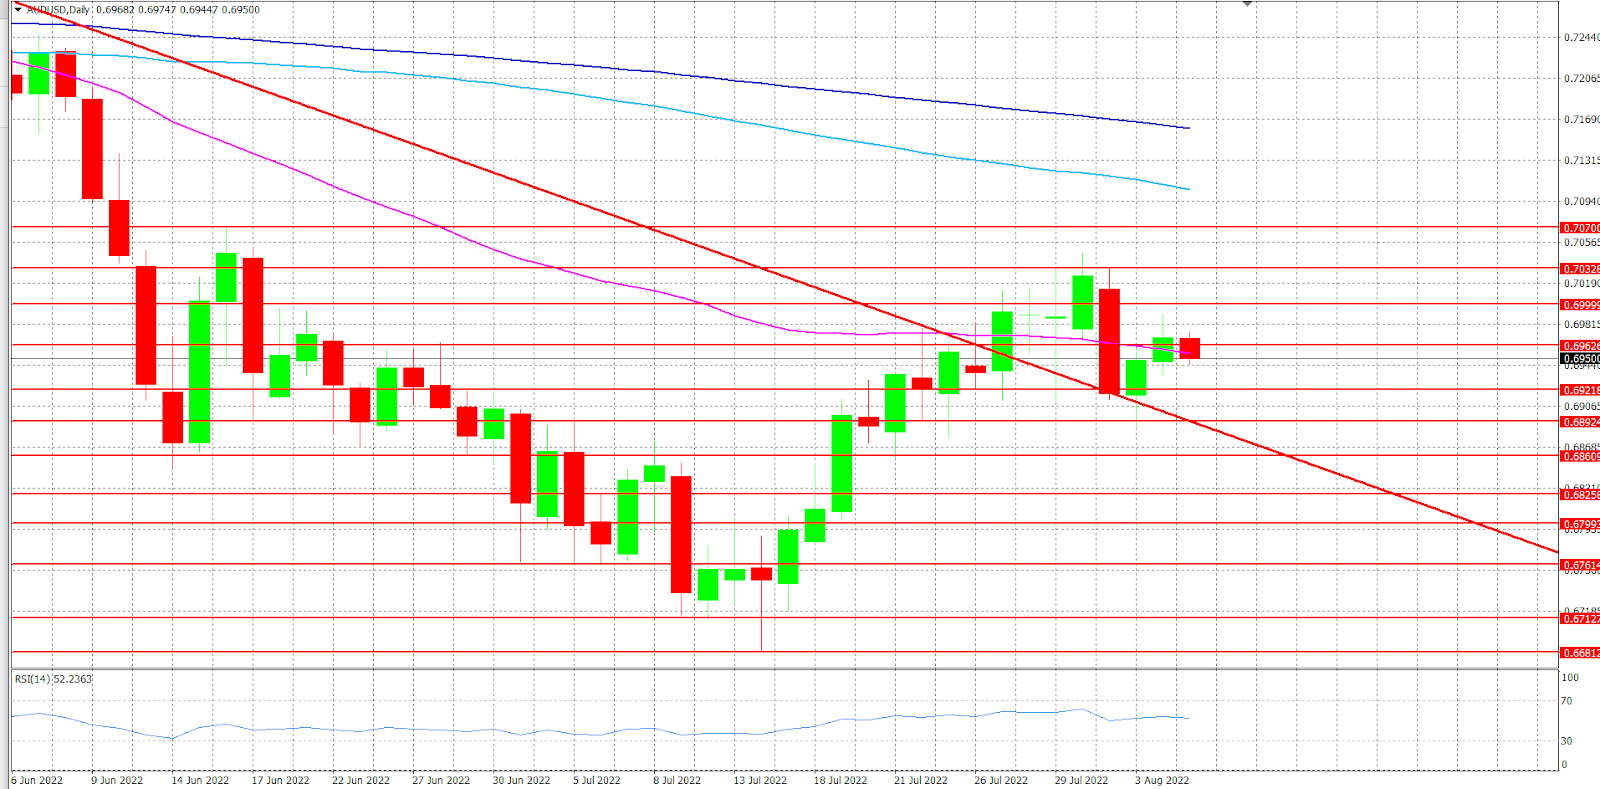
On a four-hour timeframe, the Moving Average Indicator reading reveals bullish signals. The signal indicates the continuance of the bullish trend in the short term. whereas the 50-MA rises above the 100-MA. In the meantime, the 100-MA rises above the 200-MA, supporting the bullish trend over the longer period. With a score of 52.8 on the value line, the Relative Strength Index remains in the neutral range. Any increase in the RSI would protect the Australian dollar from sliding back below the descending trendline.
During the preceding two trading sessions, the AUD/USD exchange rate has been quite stable. Therefore, if the AUD/USD wants to maintain its positive trajectory, the Aussie must break through the first resistance level at 0.6962. A successful break of the indicated level would pave the way for yesterday's high of 0.6999. If the price is capable of closing the 4-hour candlestick above yesterday's high, that will shift market participants' focus to the 0.7032 level, followed by the 0.7070 resistance level, which prevented the bullish trend continuation on Monday.
Alternatively, if the market is unable to advance over the resistance level of 0.6962, that may cause the price to slide toward the support level of 0.6921. A successful breach of the previously mentioned level would allow the price to retest the 0.6892 support level, which coincides with the descending trend line. A breach of this level would expose the support levels at 0.6860, followed by a 0.6835 support level.
Note: When a resistance level is broken, it becomes a support level since the price will trade above it, and vice versa. Alternatively, the market may perform a false breakout or rebound after breaking support, or vice versa. Additionally, the market could bounce from any level of support or decline after breaking any level of resistance.
Author

Mohammad Quqas
Independent Analyst
Mohammad Quqas has a bachelor's degree in finance and banking. He has been trading forex for years, which has given him expertise in working with foreign currencies, commodities, and indices. As a result, he's knowledgeable about forex and trading.


