The impact of coronavirus on the High Beta Currency, Krona
The Krona is still lagging
The Swedish currency Krona might not be as familiar as it sounds. The Krona movement is still far behind other types of currencies. Most of the data releases scheduled next week have little effect on SEK, and while there may be some possible attention to retail sales, the impact may still be relatively weak. What is interesting is the movement of Krona, in relation to the European data towards the end of the week which could potentially move the USDSEK or EURSEK pair due to the Krona’s sensitivity to European sentiment.
Like other high beta currencies, news about coronavirus will determine most of the dynamics in the near future. Although lagging with other major currencies, next week’s movements seem to have a pretty good prospect of a rally for the USDSEK pair.
The beta of an investment measures its sensitivity to market returns. Unlike in equities, in FX the relevant benchmark for a beta cannot be a long-only index. Instead, an FX-specific beta can be based on common types of currency strategies, such as carry and trend. Currency betas measured against such benchmarks can be valuable for portfolio construction and measuring positioning risk.
Technical USD/SEK
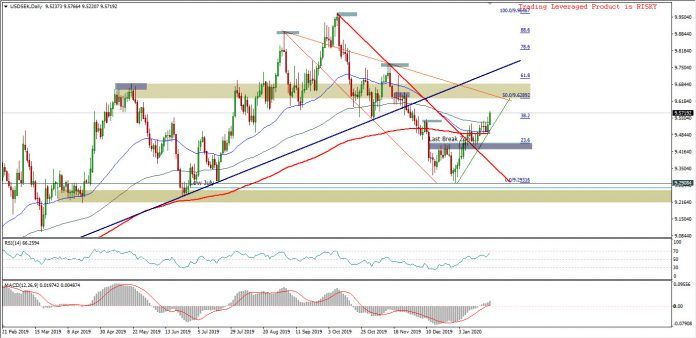
USD/SEK, Daily Chart.
The rally of this currency pair has been well confirmed, with a Breakout of the descending trendline, already. The price position is above the MA slope of 50-,120- and 200-day SMA. RSI in the positive sentiment zone, while MACD is in the buy zone and retracing around 38.2%.
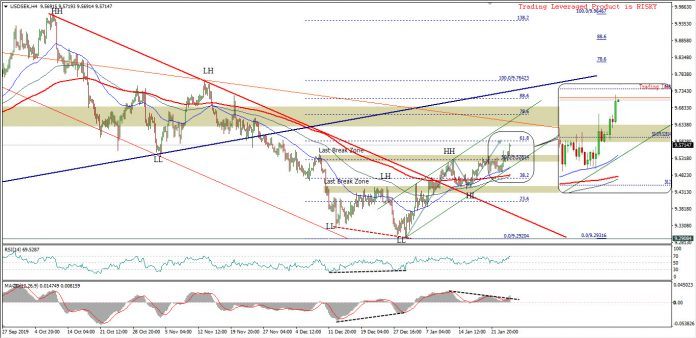
USD/SEK, Hourly Chart.
The appearance of the 4-hour chart built a pretty good price construction, in addition to its dynamically rising structure, the price has also broken out 2 horizontal resistance levels at 9.4411 / 9.5444, as well as the diagonal resistance of the descending trendline. Using the candlestick formation above 3 MA as a price indicator, RSI and MACD are seen supporting the price movement to the north. If this rally continues, the reference resistance will be at the level of 50.0% or 61.8% of the Fib. retracement, from the high prices in October 2019 and the low prices in December 2019. If a correction occurs from the rising wave then the price will likely return to the last resistance crossed which is at the 23.6% Fib. level.


