The Golden opportunity: Navigating the recent drop in Gold prices

Despite the recent drop in gold prices, the enduring strength of the commodity as an investment tool remains undeterred. This conclusion is based on the current economic indicators, specifically, the continual growth of actual personal consumption expenditure and the rise in the Federal Reserve’s rates. This article examines these factors and explores the potential buying opportunities in the gold market that arise as a result of the recent dip in prices.
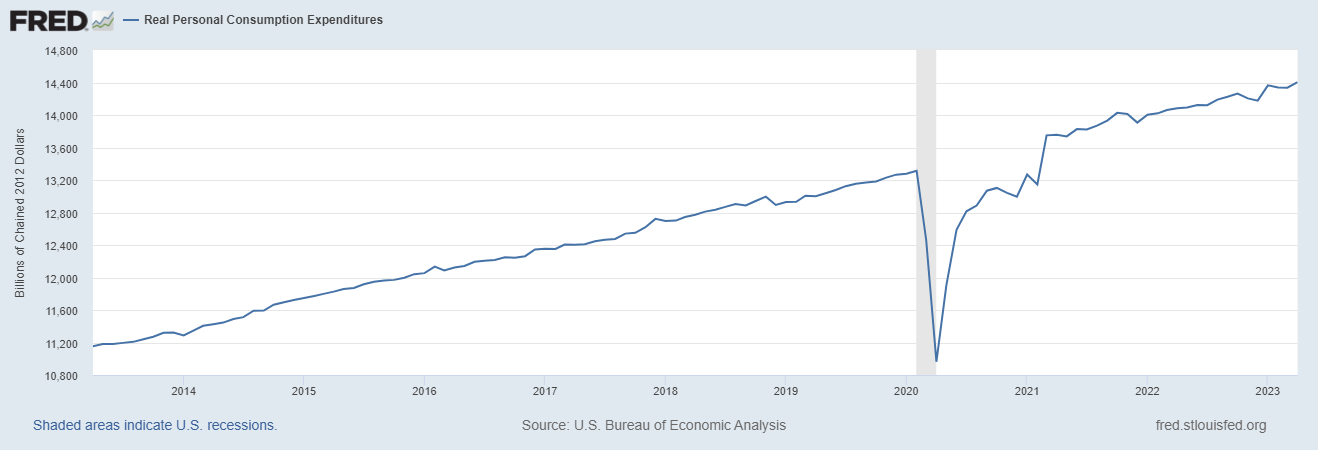
The real personal consumption expenditure continues to grow at an annual rate of 2.4%. This rate has been maintained despite the hike in the Federal Reserve’s rates, a circumstance that attests to the relative stability of the US economy. Consequently, the dip in gold prices does not necessarily indicate a reduction in the intrinsic value of the commodity.
Technical reasons behind Gold drop
There is a widespread belief that the drop in gold prices offers an attractive entry point for investors. From a historical perspective, this decline was not unexpected. The market had long been preparing for this drop, with predictions stemming from the strong pivot at $2,075 per ounce. The present climate does not advocate for a sell-off for investors who already possess gold assets. On the contrary, holding onto gold during this time is recommended. There are technical reasons behind this advice that can be discerned from a detailed study of the long-term chart of gold prices. The chart displays the formation of an inverted head and shoulders pattern, with the neckline serving as the key level. This pattern is significant because it is traditionally regarded as a bullish formation, hinting at a likely future rally in the gold market. The gold price was seen reversing lower from this key level, contributing to the current dip.
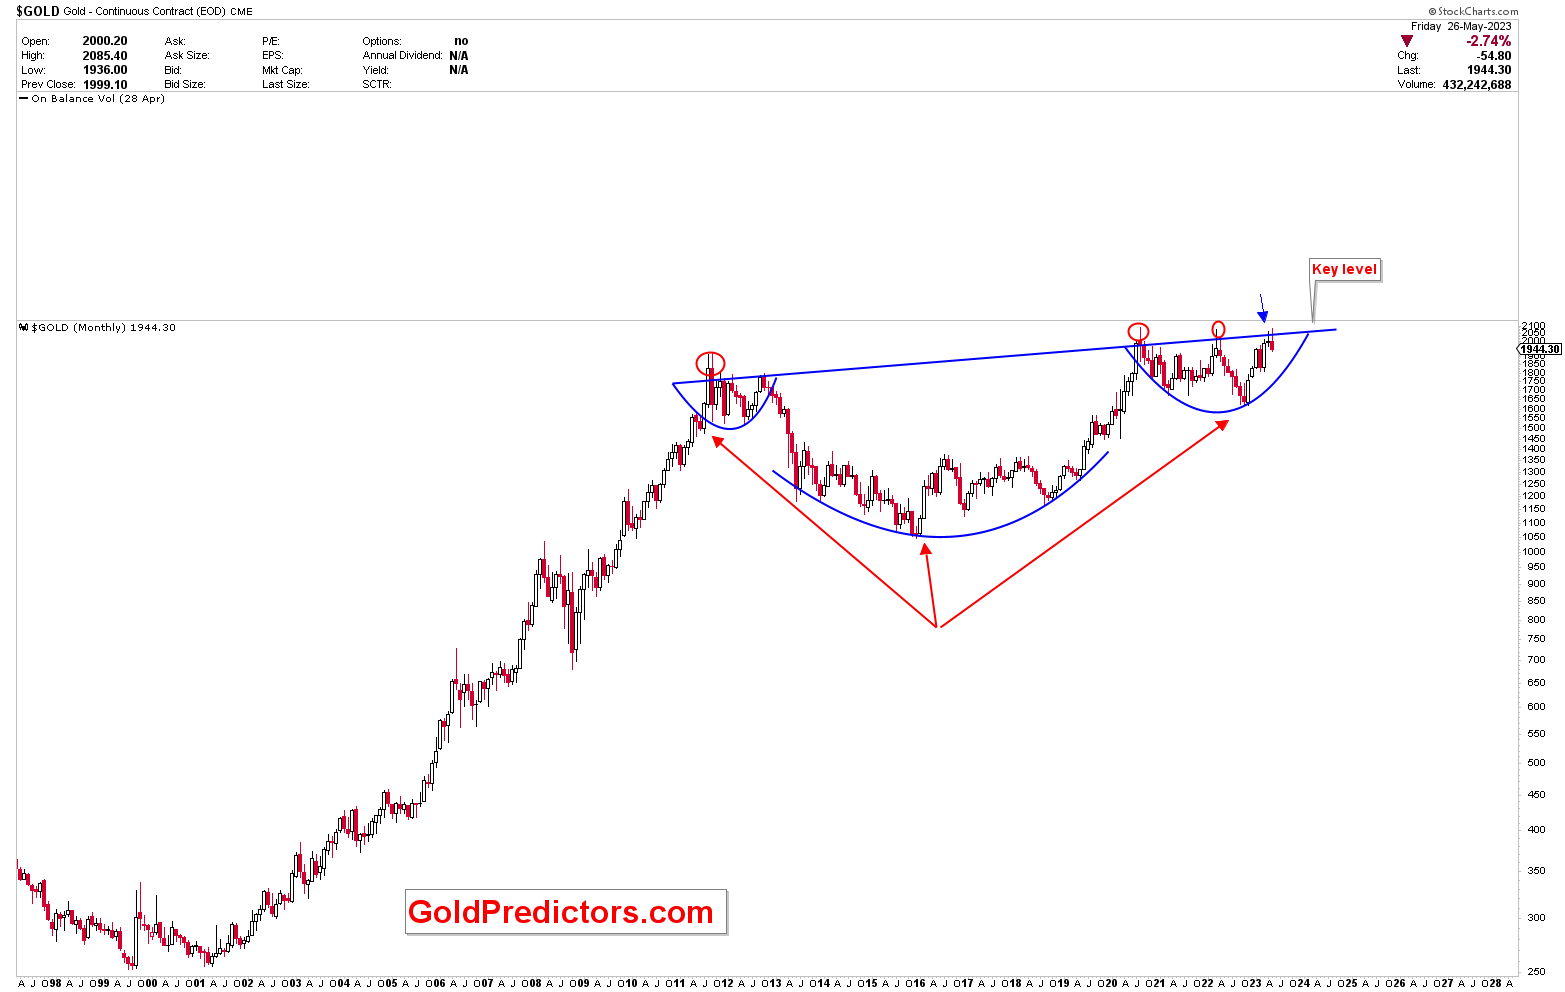
The inverted head and shoulders formation suggests that the current drop in the gold price might find support around the $1,800-$1,900 region. This range is interpreted to be the support level observed by the arc of the right shoulder of the pattern. It provides a potentially advantageous buying opportunity for investors looking to enter or bolster their position in the gold market.
Key action for investors
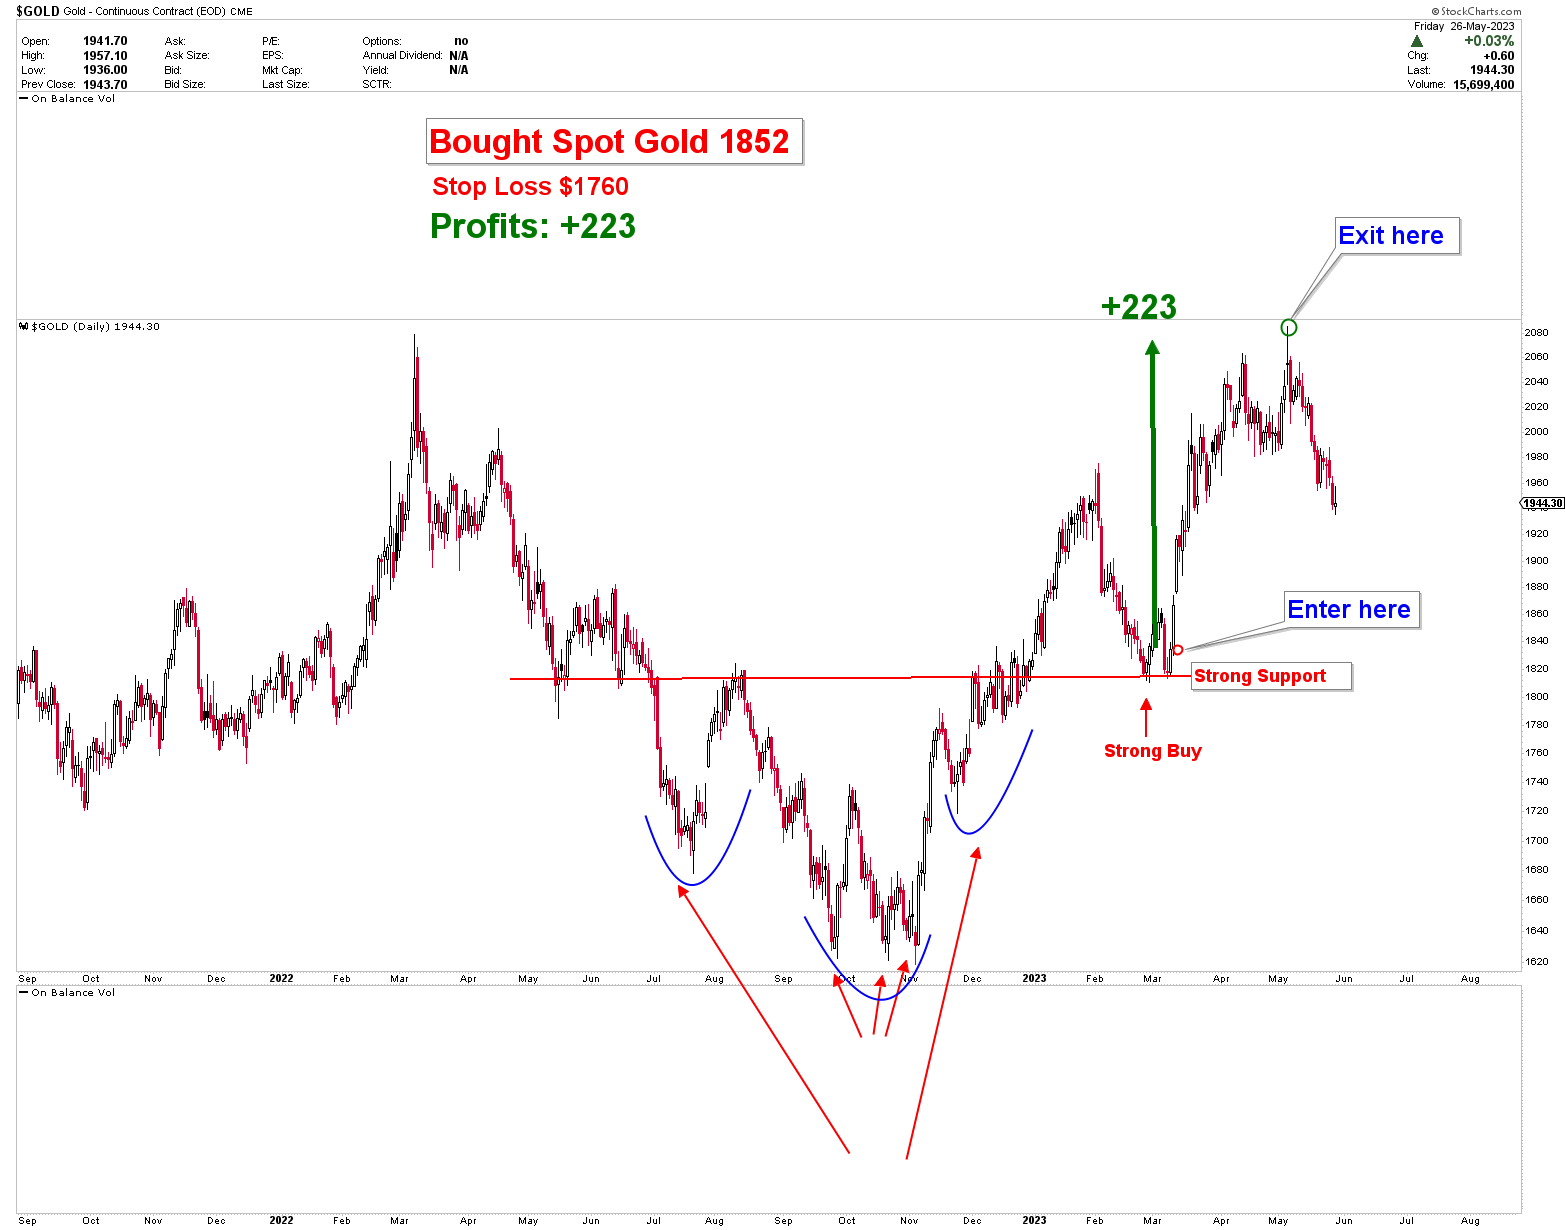
Investors are poised to capitalize on the current dip in gold prices by maintaining long positions in the vicinity of the $1,800 and $1,900 price regions. Yet, it’s crucial to understand that the precise numbers will hinge on the exact cycle time and the level of support when the price arrives at the mentioned support region. Illustrating this, the last trade was conducted at $1,852 and exited at $2,075, despite the gold price peaking in the 2080 region. The price started to recede after the trade was completed, indicating the anticipated dip in the market. This dip is expected to provide another lucrative opportunity, details of which will be shared with our premium members once the trade has been executed.
Bottom line
In conclusion, while a superficial analysis may suggest a weakening in the gold market, a deeper, more technical examination tells a different story. The recent drop in gold prices is not a sign of a long-term downtrend but rather a temporary occurrence that is expected based on technical analysis and macroeconomic factors. Consequently, this decline offers an opportune time for investors to purchase or hold gold in anticipation of a strong rally in the future.
Unlock exclusive gold and silver trading signals and updates that most investors don’t see. Join our free newsletter now!
Author

Muhammad Umair, PhD
Gold Predictors
Muhammad Umair is a financial markets analyst and investor who focuses on the forex and precious metals markets.


