|

The FANG Stocks Confirm A Bear Market


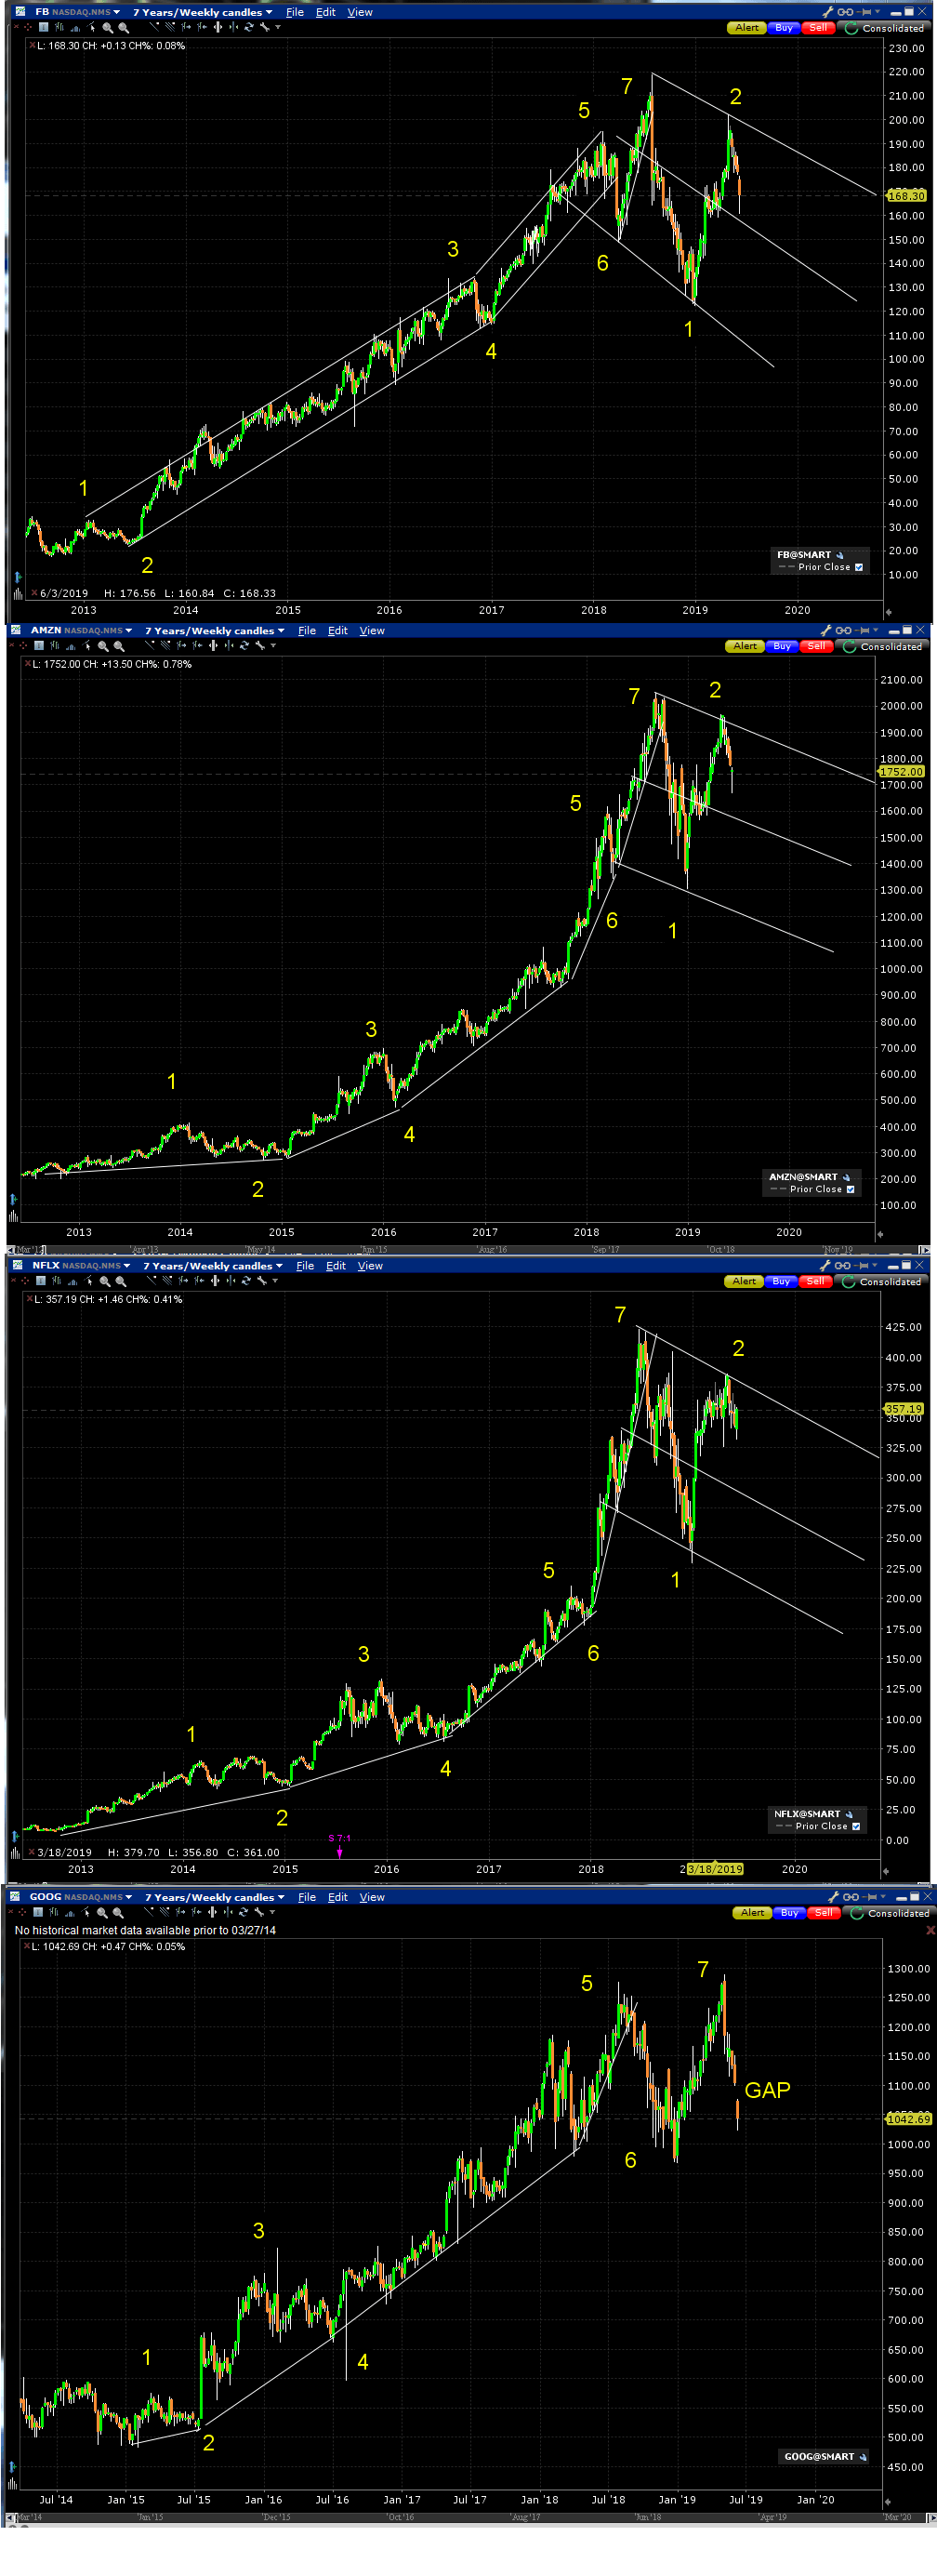
The darlings of the bull market of the last decade have been the FANG stocks: Facebook, Amazon, Netflix, and Google. This four part chart of these four stocks show that three of the FANG stock peaked in 2018, and the fourth, Google, has peaked this year. 

The Facebook, Amazon, and Netflix charts look nearly identical. Each shows a 7 move up Chaos Clamshell, followed by two of a possible 7 moves of a down Chaos Clamshell. Google is the only one of the FANG stocks to make a higher high in 2019. That apparent strength was negated by the gap down on the weekly chart

This strongly suggests that the US stock market is in a bear market. Typically, since WWII, US bear markets have lasted an average of 14 months. The longest was 61 months. The pattern on the FANG charts suggest this one will probably run into the spring of 2021. Typical bear markets have declined about 33%, with the longest declining over 60%. During these periods, investors should consider moving into cash ( "Cash Is King") or gold

This content was published on Dr. Al Larson's Chaos Clinic which you can attend each Friday for free.

Dr. Al Larson has developed a complete Chaos Model of Markets, four unique courses that let you become a Certified Chaos Trader, some very unique eMylar fractal pattern overlays, and tools that permit forecasting individual stocks and markets years in advance. You can also sign up for a free weekly email, and attend a free Chaos Clinic on Fridays. To learn more, click on the author's profile.

Be sure to sign up for the free weekly email! 

Author

Dr. Al Larson, PhD

Dr. Al Larson, PhD

MoneyTide.com

Dr. Al Larson holds a Ph.D. in Electrical and Computer Engineering from the University of Wisconsin. He is a 1964 Distinguished Graduate of the U. S. Air Force Academy.

More from Dr. Al Larson, PhD
Share:

Editor's Picks

EUR/USD flirts with daily highs, retargets 1.1900

EUR/USD regains upside traction, returning to the 1.1880 zone and refocusing its attention to the key 1.1900 barrier. The pair’s slight gains comes against the backdrop of a humble decline in the US Dollar as investors continue to assess the latest US CPI readings and the potential Fed’s rate path.

GBP/USD remains well bid around 1.3650

GBP/USD maintains its upside momentum in place, hovering around daily highs near 1.3650 and setting aside part of the recent three-day drop. Cable’s improved sentiment comes on the back of the Greenback’s  irresolute price action, while recent hawkish comments from the BoE’s Pill also collaborate with the uptick.

Gold clings to gains just above $5,000/oz

Gold is reclaiming part of the ground lost on Wednesday’s marked decline, as bargain-hunters keep piling up and lifting prices past the key $5,000 per troy ounce. The precious metal’s move higher is also underpinned by the slight pullback in the US Dollar and declining US Treasury yields across the curve.

Crypto Today: Bitcoin, Ethereum, XRP in choppy price action, weighed down by falling institutional interest 

Bitcoin's upside remains largely constrained amid weak technicals and declining institutional interest. Ethereum trades sideways above $1,900 support with the upside capped below $2,000 amid ETF outflows.

Week ahead – Data blitz, Fed Minutes and RBNZ decision in the spotlight

US GDP and PCE inflation are main highlights, plus the Fed minutes. UK and Japan have busy calendars too with focus on CPI. Flash PMIs for February will also be doing the rounds. RBNZ meets, is unlikely to follow RBA’s hawkish path.

Ripple Price Forecast: XRP potential bottom could be in sight

Ripple edges up above the intraday low of $1.35 at the time of writing on Friday amid mixed price actions across the crypto market. The remittance token failed to hold support at $1.40 the previous day, reflecting risk-off sentiment amid a decline in retail and institutional sentiment.