The EUR/GBP longer term cycles and Elliott Wave
Firstly as seen on the monthly chart below there is data back to January 1975 in the pair. The EUR part being derived from the German Deutsche Mark up until the point EURUSD currency existed.
Secondly as seen on the monthly chart below I will describe how I think the pair has risen thus far & what can be seen in the future. You can see the bounce from the February 1981 lows appears to be 3 swings to the November 1995 highs. There are usually a few counts that can be valid. This move appears to be a double three. I prefer to use momentum indicators to show when a cycle ends from any point in time. Whenever a proposed wave two, B, X or wave four of any degree has been taken by the momentum indicator it is likely it has ended that cycle whether it is up or down.
The analysis continues below the monthly chart
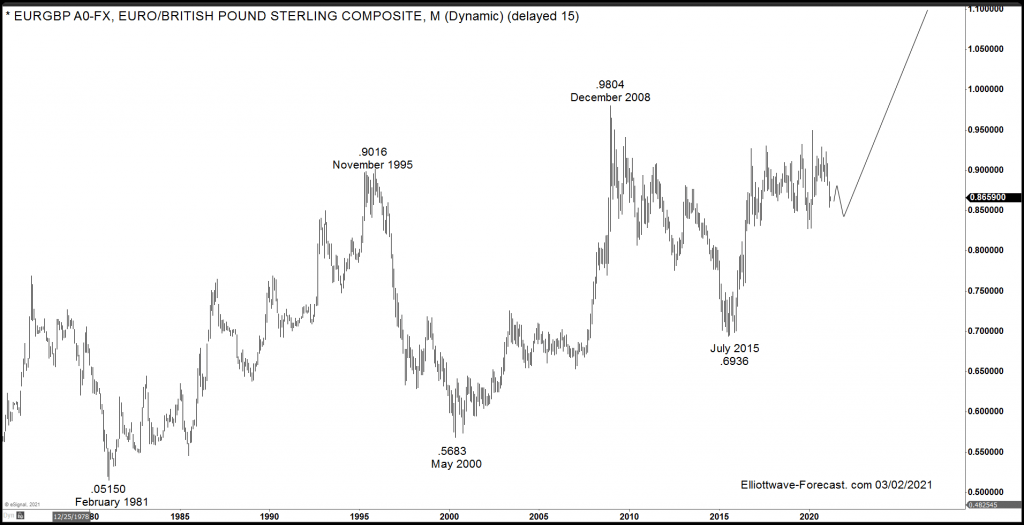
From the November 1995 highs the pair declined hard enough to the May 2000 lows to suggest it was correcting the cycle from the February 1981 lows. Up from the May 2000 lows it made another high in December 2008. From there it declined until July 2015 hard enough to suggest it was correcting the cycle up from the February 1981 low again. That suggests the move from the February 1981 low to the December 2008 high was of three swings. The aforementioned December 2008 to July 2015 lows move appears to have been another typical three swings.
The analysis and Elliott Wave part of this continues below the weekly chart
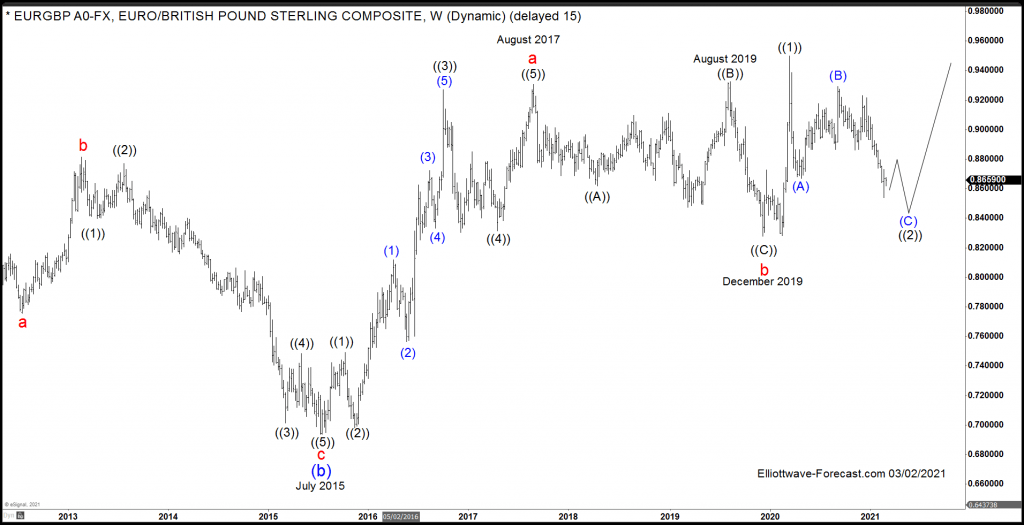
Thirdly and in conclusion. From the July 2015 lows it made a relatively clean five waves impulse higher to the August 2017 highs. From there the pair traded sideways to lower until it made another 5 waves up to the August 2019 highs. That finished an expanded flat ((B)) structure. Then so much for the old rule of alternation, the decline to the December 2019 lows was five waves. This also completed a larger degree expanded flat b. The pair should be bullish in the larger degree while above there. While above there expect the pair continues higher above the December 2008 highs.
Author

Elliott Wave Forecast Team
ElliottWave-Forecast.com


