The Dow Jones Industrial Average and SP 500 were headed for their biggest one-week losses since the financial crisis
REVIEW
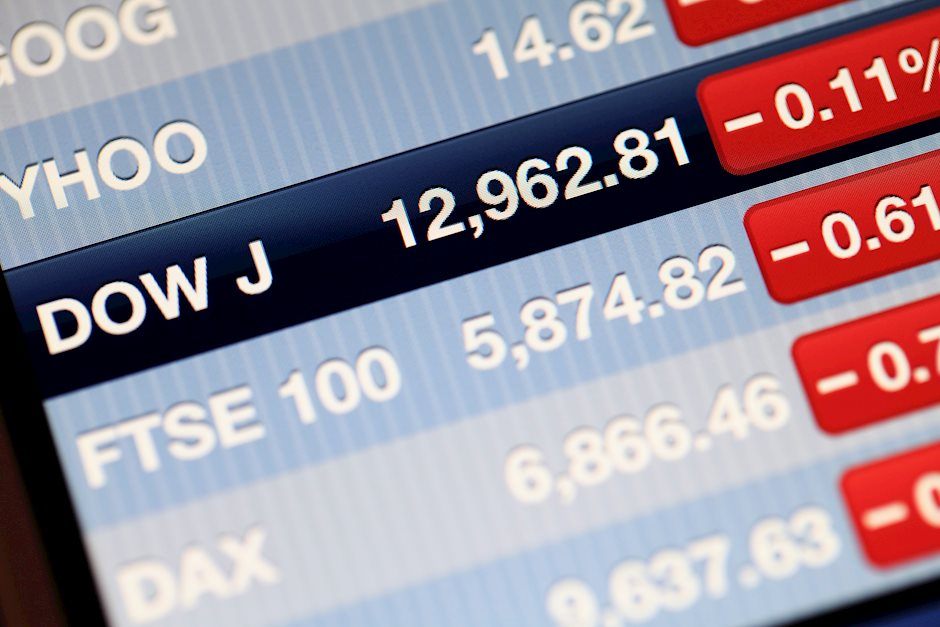
The 10-year U.S. Treasury yield plunged to a fresh record low on Friday as investors dumped riskier assets and searched for safer options amid the coronavirus outbreak. The outbreak sent investors fleeing equities in favor of Treasuries, which have traditionally been a safer alternative to stocks. The Dow Jones Industrial Average and S&P 500 were headed for their biggest one-week losses since the financial crisis. Yields tumbled as the Fed signaled late Friday it might be willing to support the economy if necessary. – Yun Li and Fred Imbert, "10-Year Treasury Yield Collapses to Another Record Low Below 1.12%," www.cnbc.com, February 28, 2020.
Here's a thought: Maybe we in the media should spend more time talking to the experts who know something and less time quoting politicians who know almost nothing about the virus but see potential gain in exploiting a health crisis. Opinion Page, "The Coronavirus Isn't Partisan," Wall Street Journal, February 28, 2020.
Where do you even start this weekly column after a week like this?
I suppose you could start with gratitude for the people in life who are so supportive of your work. So, thank you to all who have sent emails, texts, phone calls, etc. commending us on the forecasts made in the Forecast 2020 Book, the Forecast 2020 webinars and speeches, and our various subscription reports. All of these reports and talks forecasted a sharp decline was due and that would exceed the sharpest decline of 2019 (7.5%), but probably not sharper than the decline that took place October-December 2018 (19.2% in the DJIA, over 20% in the S&P), and that this decline was ideally due by March 2020. However, being correct about alerting readers to a severe decline that just happened (and may still be in process) isn't something you can rest a reputation on. As a market analyst, you are only as good as last your call, and more important is your next call. Calling the top is one thing. Calling the bottom that follows, and the exceptional buying opportunity it will present, is equally as important and challenging. And for that reason, we will issue a special stock market update to all subscribers of all MMA reports on Monday evening, March 2, wherein we will offer our studies and their projections on when the cycle bottom is due.
There is an old saying that I give to all students of MMA classes: "Markets go up in steps, and they come down in elevators." In the last week, it seemed that all the cables holding the elevator up just completely broke, as equity markets all over the world experienced record daily and weekly declines. It makes one wonder if these structures (elevators, buildings, economies, governments) were built on sand, a deck of cards, or something substantial that would last. We will soon find out, as the full moon on March 8-9 will take place with the Sun and Neptune conjunct in Pisces, and Mercury the Trickster will end this particularly treacherous retrograde cycle.
It wasn't only the stock markets of the world that fell hard last week. So did Crude Oil, Gold, Silver, and the U.S. Dollar. What? How does Gold and Silver fall so hard along with the U.S. Dollar? Only with Mercury retrograde in Pisces. On the other hand, it was a great week for treasuries and currencies, as long-term interest rates in the U.S. fell to a new all-time low. That is more a function of the Saturn/Pluto cycle as outlined with graphs and studies provided in the Forecast 2020 Book. But not to worry. This low in interest rates won't likely last long, per those studies. As a side note, if you haven't gotten a copy of the Forecast 2020 Book and wish to get an idea of what the rest of the year looks like, we still have about 20 copies in stock. They usually sell out by March.
SHORT-TERM GEOCOSMICS AND LONGER-TERM THOUGHTS
"I just get the feeling Mercury is playing a big joke on everyone" Gianni Di Poce, MMA Cycles Analyst, in email to Ray Merriman late last week.
There is so much going on right now with geocosmic and cycle studies that it will take a few pages to adequately explain. But let's briefly go over some of the more important geocosmic matters, for 1) this is a column whose purpose is to educate the reader on the relationship of geocosmic studies to financial and political cycles, and 2) there is a lot of incomplete and possibly misleading information on this subject that is being dispersed online. Let's begin with one of the basic premises about astrological delineation: If a possibility shows up via conventional astrological interpretation, it might have legs. But to be on sturdy ground for a forecast, it is best to see at least three signatures that point to the same possibility. Or, if using just one factor, it would be of value if several past incidents can be shown that demonstrate a consistency between the signature and the outcome. Offering only the last instance of a particular geocosmic combination as "proof" that it will likely happen again is weak – and usually unreliable. Not to be too critical (because it is interesting), but there is too much of this type of "observation" offered online to explain what happened last week.
A good place to begin is with the most significant planetary phenomenon in effect in 2020, and that is – was – the 32-37-year Saturn/Pluto conjunction in Capricorn on January 12. Its orb can have a correlation to world conditions for up to two years. In the study of Astrology, Pluto pertains to events or conditions that threaten human life and/or systems of operation. Saturn pertains to basic structures and foundations, like buildings, governments, the world financial system, and economies. The Coronavirus and its unfolding drama is indeed such a threat, both to lives and systems of human functioning. And yes, the last two times this long-term cycle occurred also corresponded to threats to human lives, with the outbreak of Aids in the last case in the early 1980's and polio in the mid to late 1940's. In each case cures were discovered, and the threat was eventually contained.
Next, we consider the Jupiter/Pluto conjunction, which will occur three times due to Jupiter's retrograde motion in 2020. The first pass will be on April 4, 2020. The last time this conjunction unfolded was December 11, 2007, the very month that the "Great Recession" began, and just two months after the then all-time high formed in the Dow Jones Industrial Average on October 11, 2007. The all-time high in the DJIA now has occurred on February 12, a little less than 2 months before this aspect is to unfold. That's interesting. But if you go back and study the previous 11 cases (since 1860's), you will also find that long-term cycle lows or highs occurred within two months, and more often they were crests than troughs.
We have already provided studies of Jupiter's transit between 10º Sagittarius and 20º Capricorn in our recent webinar as well as a recent edition of the MMA Cycles Report, demonstrating its 90+% correspondence to long-term cycle crests in U.S. stock indices. Jupiter moves into 20º Capricorn these next two weeks and will do so twice again before November This was one of the factors for our forecast of an important market top likely to be achieved by March 2020. Thus, we have three major long-term planetary cycles that either correlated historically with important tops in US equities and/or implied – via their astrological meanings – that something big (i.e. a "Black Swan") – could happen in the world that could cause a major disruption to human activity and could be reflected in the price of world stock indices.
Now there are shorter planetary signatures that could narrow the current time as being important. But realistically, no professional astrologer would depend solely on these shorter-term geocosmic signatures to make a forecast that would describe the extreme type of market performance witnessed last week. Yet, within the context of the larger planetary cycles just described, it could one of several possibilities in timing such a market reaction to a greater human crisis. Let's for a moment look at those shorter-term geocosmic signatures.
First, we have Mercury retrograde in Pisces, which began February 16., and will end March 9 after it retreats back for a short time into Aquarius beginning this week, March 4. Mercury retrograde itself is often a challenging time to get facts straight and collect sufficient information to make a correct decision. But in Pisces the challenge of getting accurate data, or sufficient information, is even more challenging. On top of that, when markets start building momentum to the downside, this lack of adequate data can lead to wild speculation, which in turn fuels hysteria, and that can lead to panic, especially within the context of Jupiter (exaggeration) approaching Pluto in Capricorn (fear). Not to mention, of course, that Saturn is also in Capricorn, and these are the two primary planets related to "fear" (whereas Jupiter and Sagittarius relate to "greed").
The interesting point here is that Mercury will enter Aquarius this week, through March 16, a time that has symbolism which can support a new discovery to deal with a pressing crisis. Saturn follows with its own ingress into Aquarius (scientific discoveries) on March 21.
Another geocosmic factor that some astrologers have attributed to the force of this decline last week is the transit of Mars over the Moon's South Node, which occurred February 24. It is true that a Mars aspect can give more "fire and fury" to whatever else is going on. But by itself, it is not enough to warrant a reliable outlook of a market decline, let alone one of this magnitude. If one looks back upon the history of this geocosmic event, the correlation is rather weak and inconsistent, although there have been a couple of instances where large selloffs did occur, such as the huge sell off in October 1987. But given that this signature happens about every 18-22 months, these are exceptions rather than rules, and require at least 2-3 other geocosmic indicators to support such a forecast. By itself, I find the Mars/Node correlation to noteworthy stock market declines to be about 20% reliable, using the last 40 cases.
Now let's conclude with what is happening currently. Venus in Aries (a "detriment" combination) has started its square aspect to the "Capricorn Stellium." That is, it squared Jupiter (exaggeration) on February 23. It squared Pluto on Friday, February 28. And it will end with the square to Saturn on Tuesday, March 3. One of our rules is that any market declining into a Venus/Saturn hard aspect is a candidate for a reversal (rally) within two trading days. The next day, March 4, Venus will enter its ruling sign of Taurus, where it is strong, and Mercury will retrograde back into Aquarius, where it is open to inventions and discoveries, and less vulnerable to hysteria caused from lack of information. This offers hope to the markets, in my opinion. Shortly afterwards, the full moon occurs on March 8-9, as the Sun and Neptune will conjoin one another in the sign of Pisces (there is still some confusion and disbelief). Venus will conjoin Uranus and Mercury will end its retrograde motion at the same time, March 8-9.
I think the quote by Gianni Di Poce, a very bright rising star in Financial Astrology, given at the start of this section is apt. And we will discuss that idea in greater detail with our outlook for the US (and world) stock markets in Monday evening's special report. In the meantime, try to remain calm, seek accurate data, and avoid hysteria caused by assumptions dispersed by others. Use your own common sense.
Author

Raymond Merriman, CTA
The Merriman Market Analyst
Raymond A. Merriman is the President of the Merriman Market Analyst, Inc and founder of the Merriman Market Timing Academy.


