Bitcoin and Gold Forecast: BTC and XAU drop after hot US CPI
- Bitcoin slides toward $82,000 as investors reassess their positioning following the US CPI inflation report.
- Gold extends its correction for the third straight day, trading below $4,100 on Wednesday.
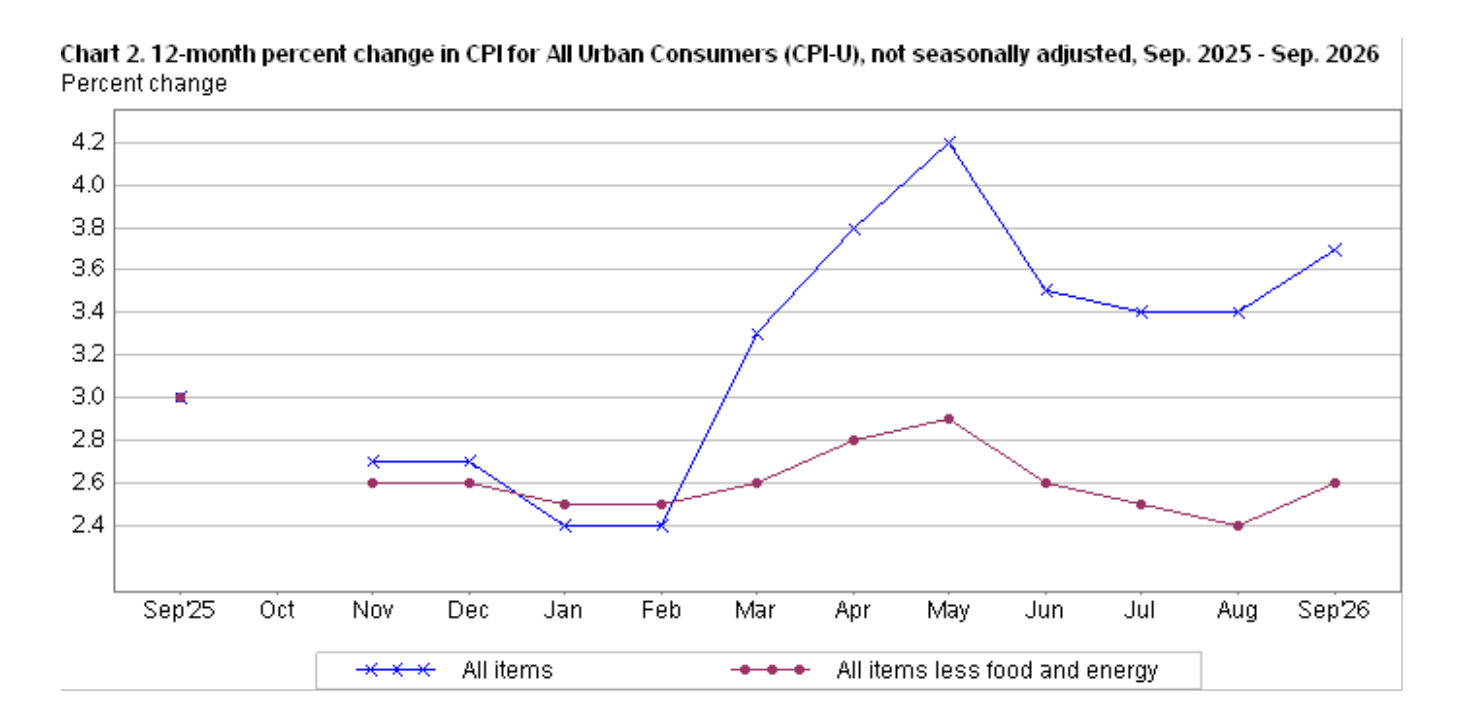
- Headline inflation in the US rose to 3.7% annually in September, underscoring sticky price pressures.

Bitcoin (BTC) is edging lower toward $82,000 on Wednesday as headwinds from sticky inflation in the United States (US) force investors to reevaluate their positioning.
Gold (XAU/USD) remains under sustained selling pressure, trading below $4,100 and falling for a third consecutive day. As the correction intensifies, a retest of key $4,000 support appears likely unless bearish momentum abates.
That said, any signs of stabilization could entice dip buyers, especially if markets absorb the inflation shock, potentially setting the stage for a rebound.
US CPI upside surprise spooks investors
The United States (US) annual inflation rate rose to 3.7% in September, above forecasts of 3.6% and up from 3.4% in August, according to the Consumer Price Index (CPI) report released on Wednesday by the Bureau of Labor Statistics (BLS).
Core CPI, excluding volatile food and energy prices, rose to 2.6% in the same month, up from 2.4% in August. Monthly CPI accelerated to 0.6% in September, up from 0.4% in August, while core CPI maintained its steady pace, increasing by 0.3% for the second consecutive month.
Market reaction
Bitcoin and Gold prices dropped after the CPI release, suggesting that hotter-than-expected inflation caught investors by surprise. The CME Group’s FedWatch tool highlights the shift in market sentiment, with odds of an October rate hike climbing to 49% on Wednesday, from roughly 22% the day before.
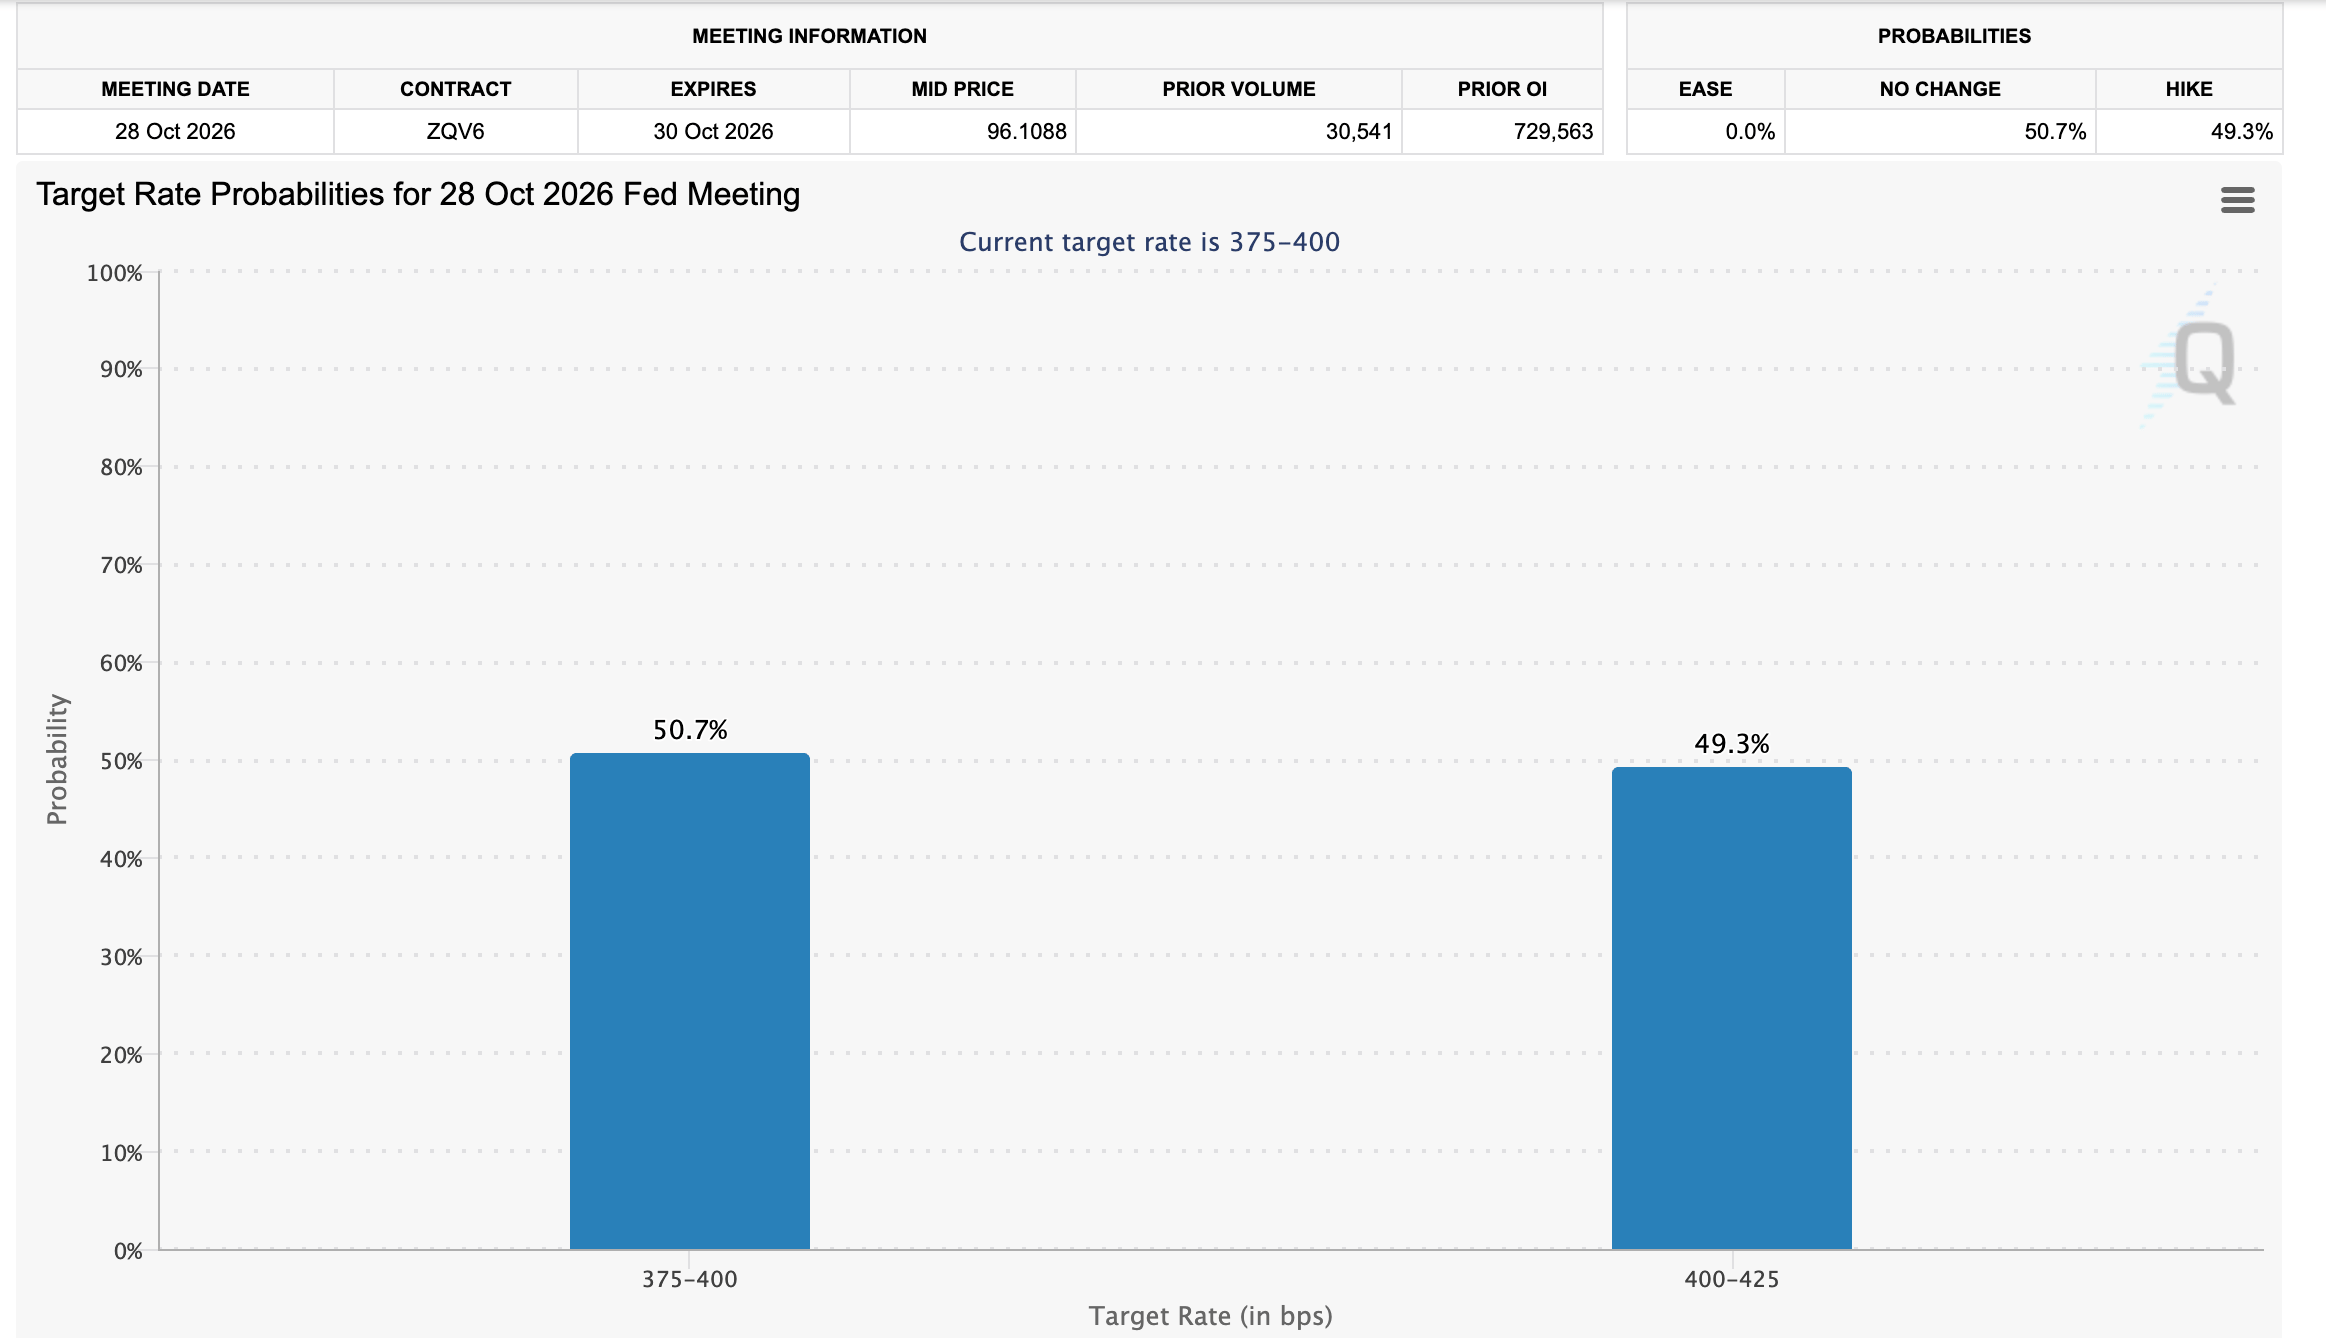
The Federal Reserve (Fed) interest rate decision is expected later this month, and with the CPI confirming sticky inflation in the US, higher rate-hike bets are likely to return.
Sustained elevated Oil and energy prices are a primary factor behind the acceleration in US inflation. The West Texas Intermediate (WTI) currently trades above $94.00, rising for five straight days.
“For crypto, the key question is what this means for monetary policy. If inflation remains sticky, the Federal Reserve has less room to ease and may need to keep financial conditions restrictive for longer,” Markus Levin, Co-founder of XYO, said in an emailed commentary, adding, “Higher yields and a stronger dollar can make it harder for Bitcoin and other risk assets to sustain a rally, particularly when investors are already cautious about risk.”
Technical analysis: Bitcoin corrects as sell-side pressure expands
Bitcoin is trading lower toward $82,000 as bears push to regain control over the trend. Attempts to break resistance at $84,000 have failed since last week, leaving BTC in lockstep with support near $80,000.
Nonetheless, Bitcoin remains well above the main Exponential Moving Averages (EMAs) and maintains a constructive near-term bias. The SuperTrend line, rising from $79,663, sits comfortably below spot and suggests the broader uptrend remains intact despite a soft Moving Average Convergence Divergence (MACD) below the zero line and a neutral Relative Strength Index (RSI) hovering around 50.
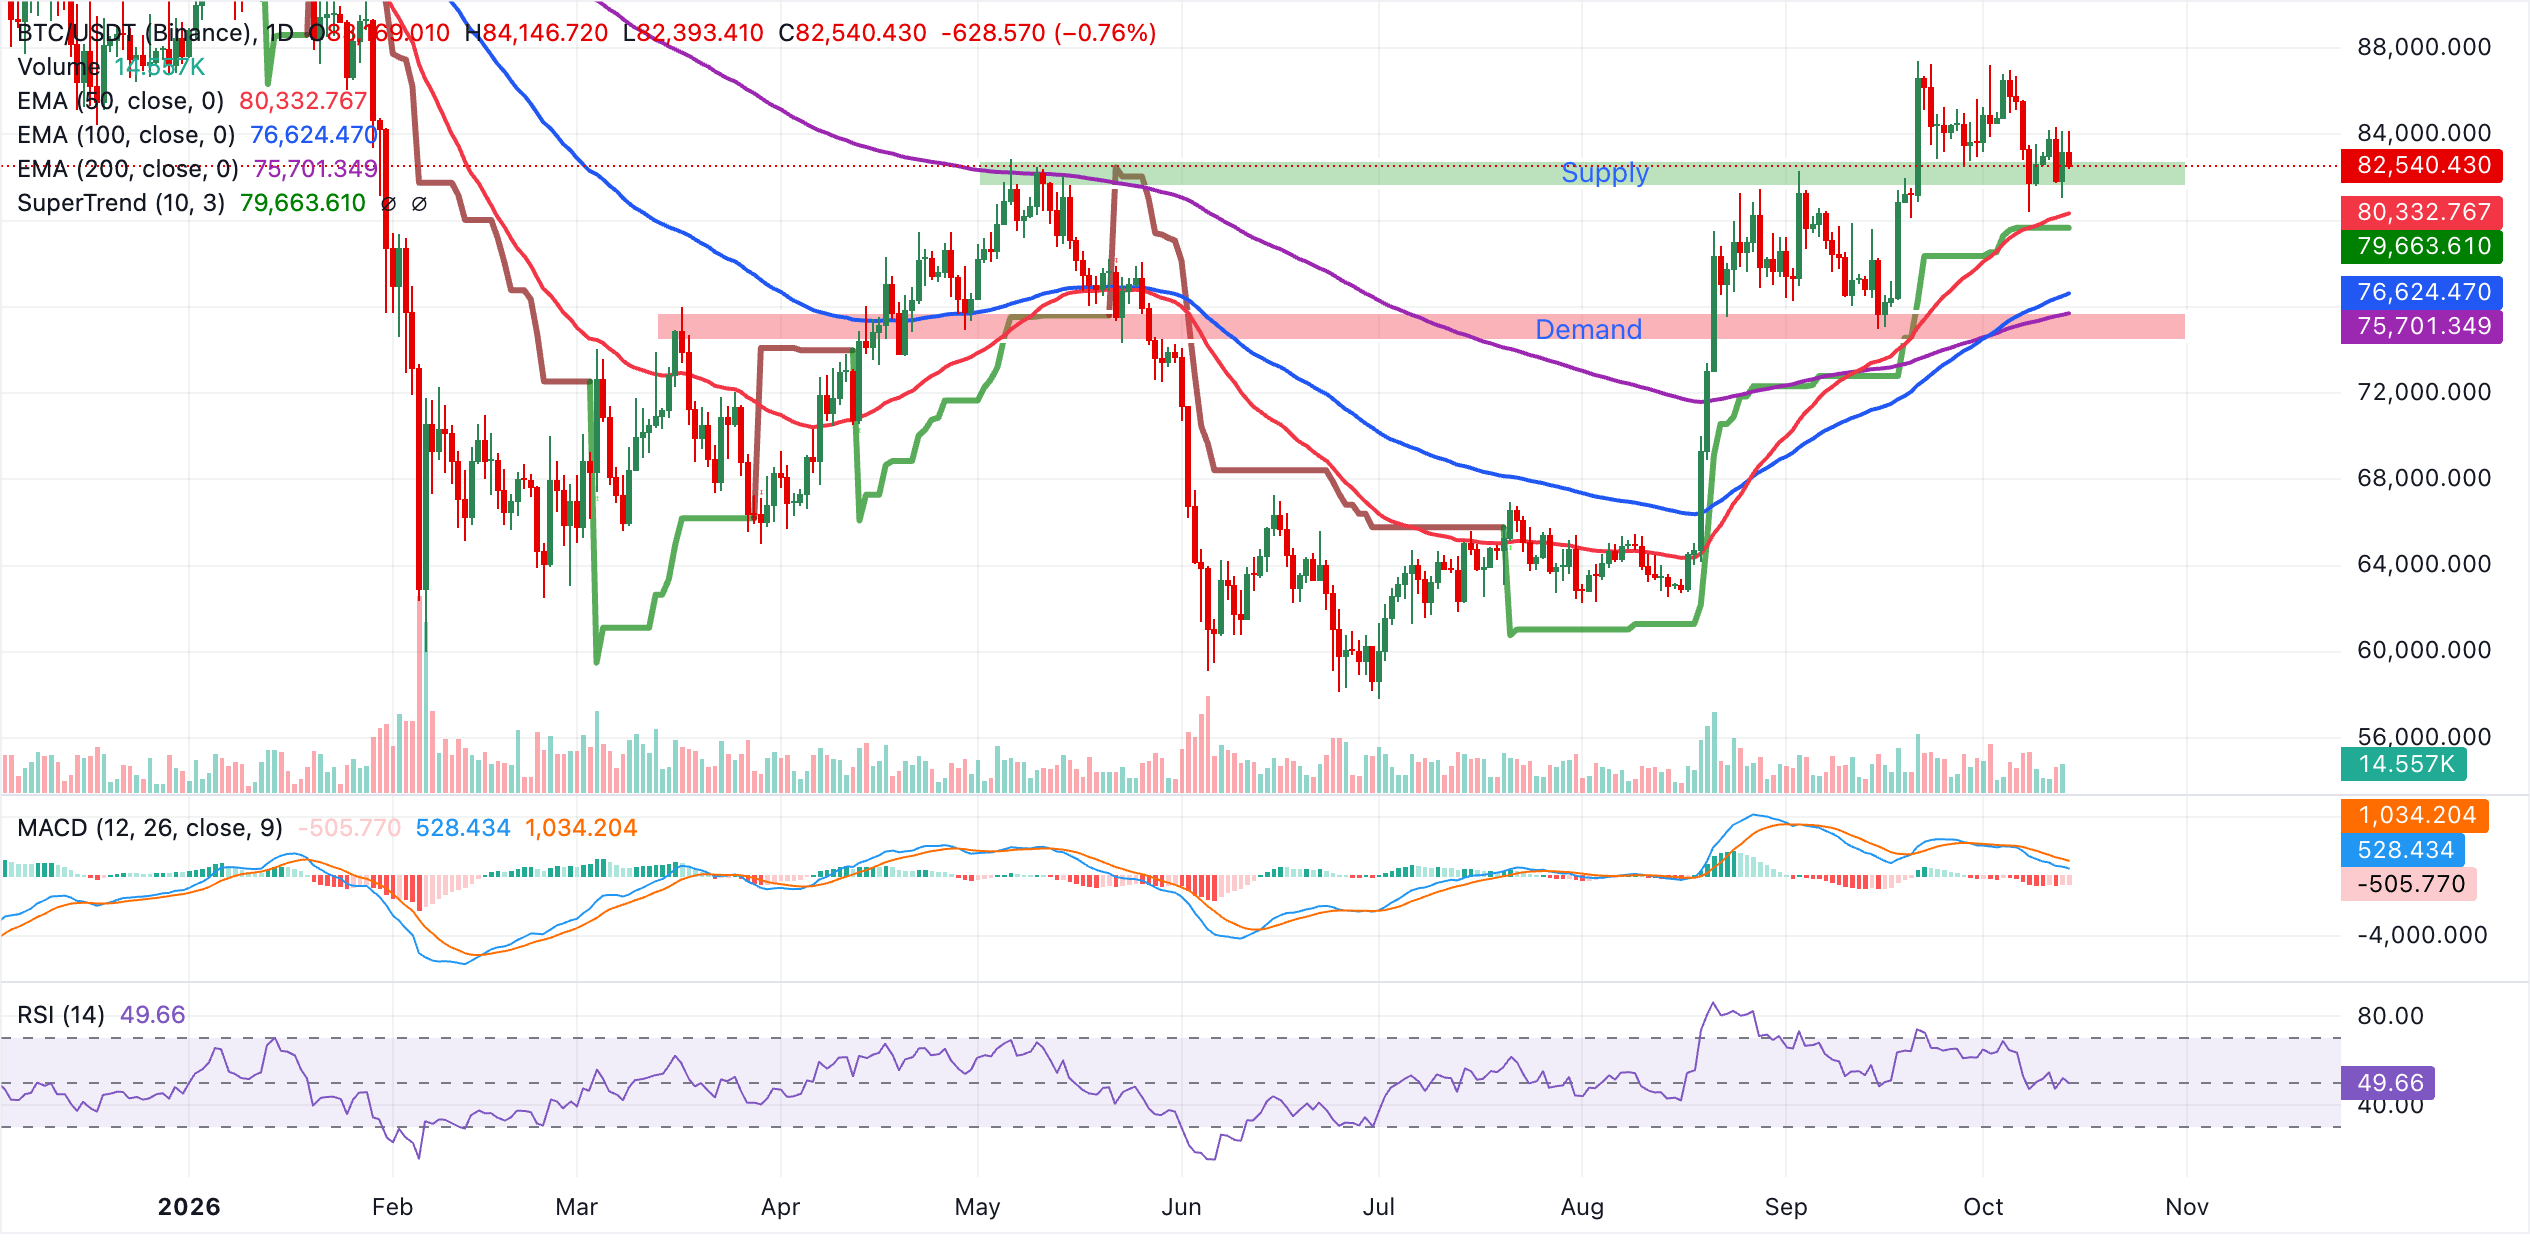
Initial support lies at the 50-day EMA near $80,333, with the SuperTrend zone at $79,664 providing a secondary floor if a deeper pullback develops. Below that, the 100-day EMA at $76,625 and the 200-day EMA at $75,701 emerge as more significant medium-term support levels that would need to hold to preserve the prevailing bullish structure.
Gold technical analysis: Gold bears tighten grip
Gold trades at $4,086, extending a bearish tone as spot remains well below the key EMAs. The 50-day EMA at $4,261, the 200-day EMA at $4,299, and the 100-day EMA at $4,309 all sit overhead, suggesting the broader trend remains under pressure despite the recent stabilization in downside momentum.
The SuperTrend line at $4,361 reinforces the capped structure, while the RSI near 38 stays below the neutral 50 level, suggesting sellers retain control even as the MACD edges toward the zero line.
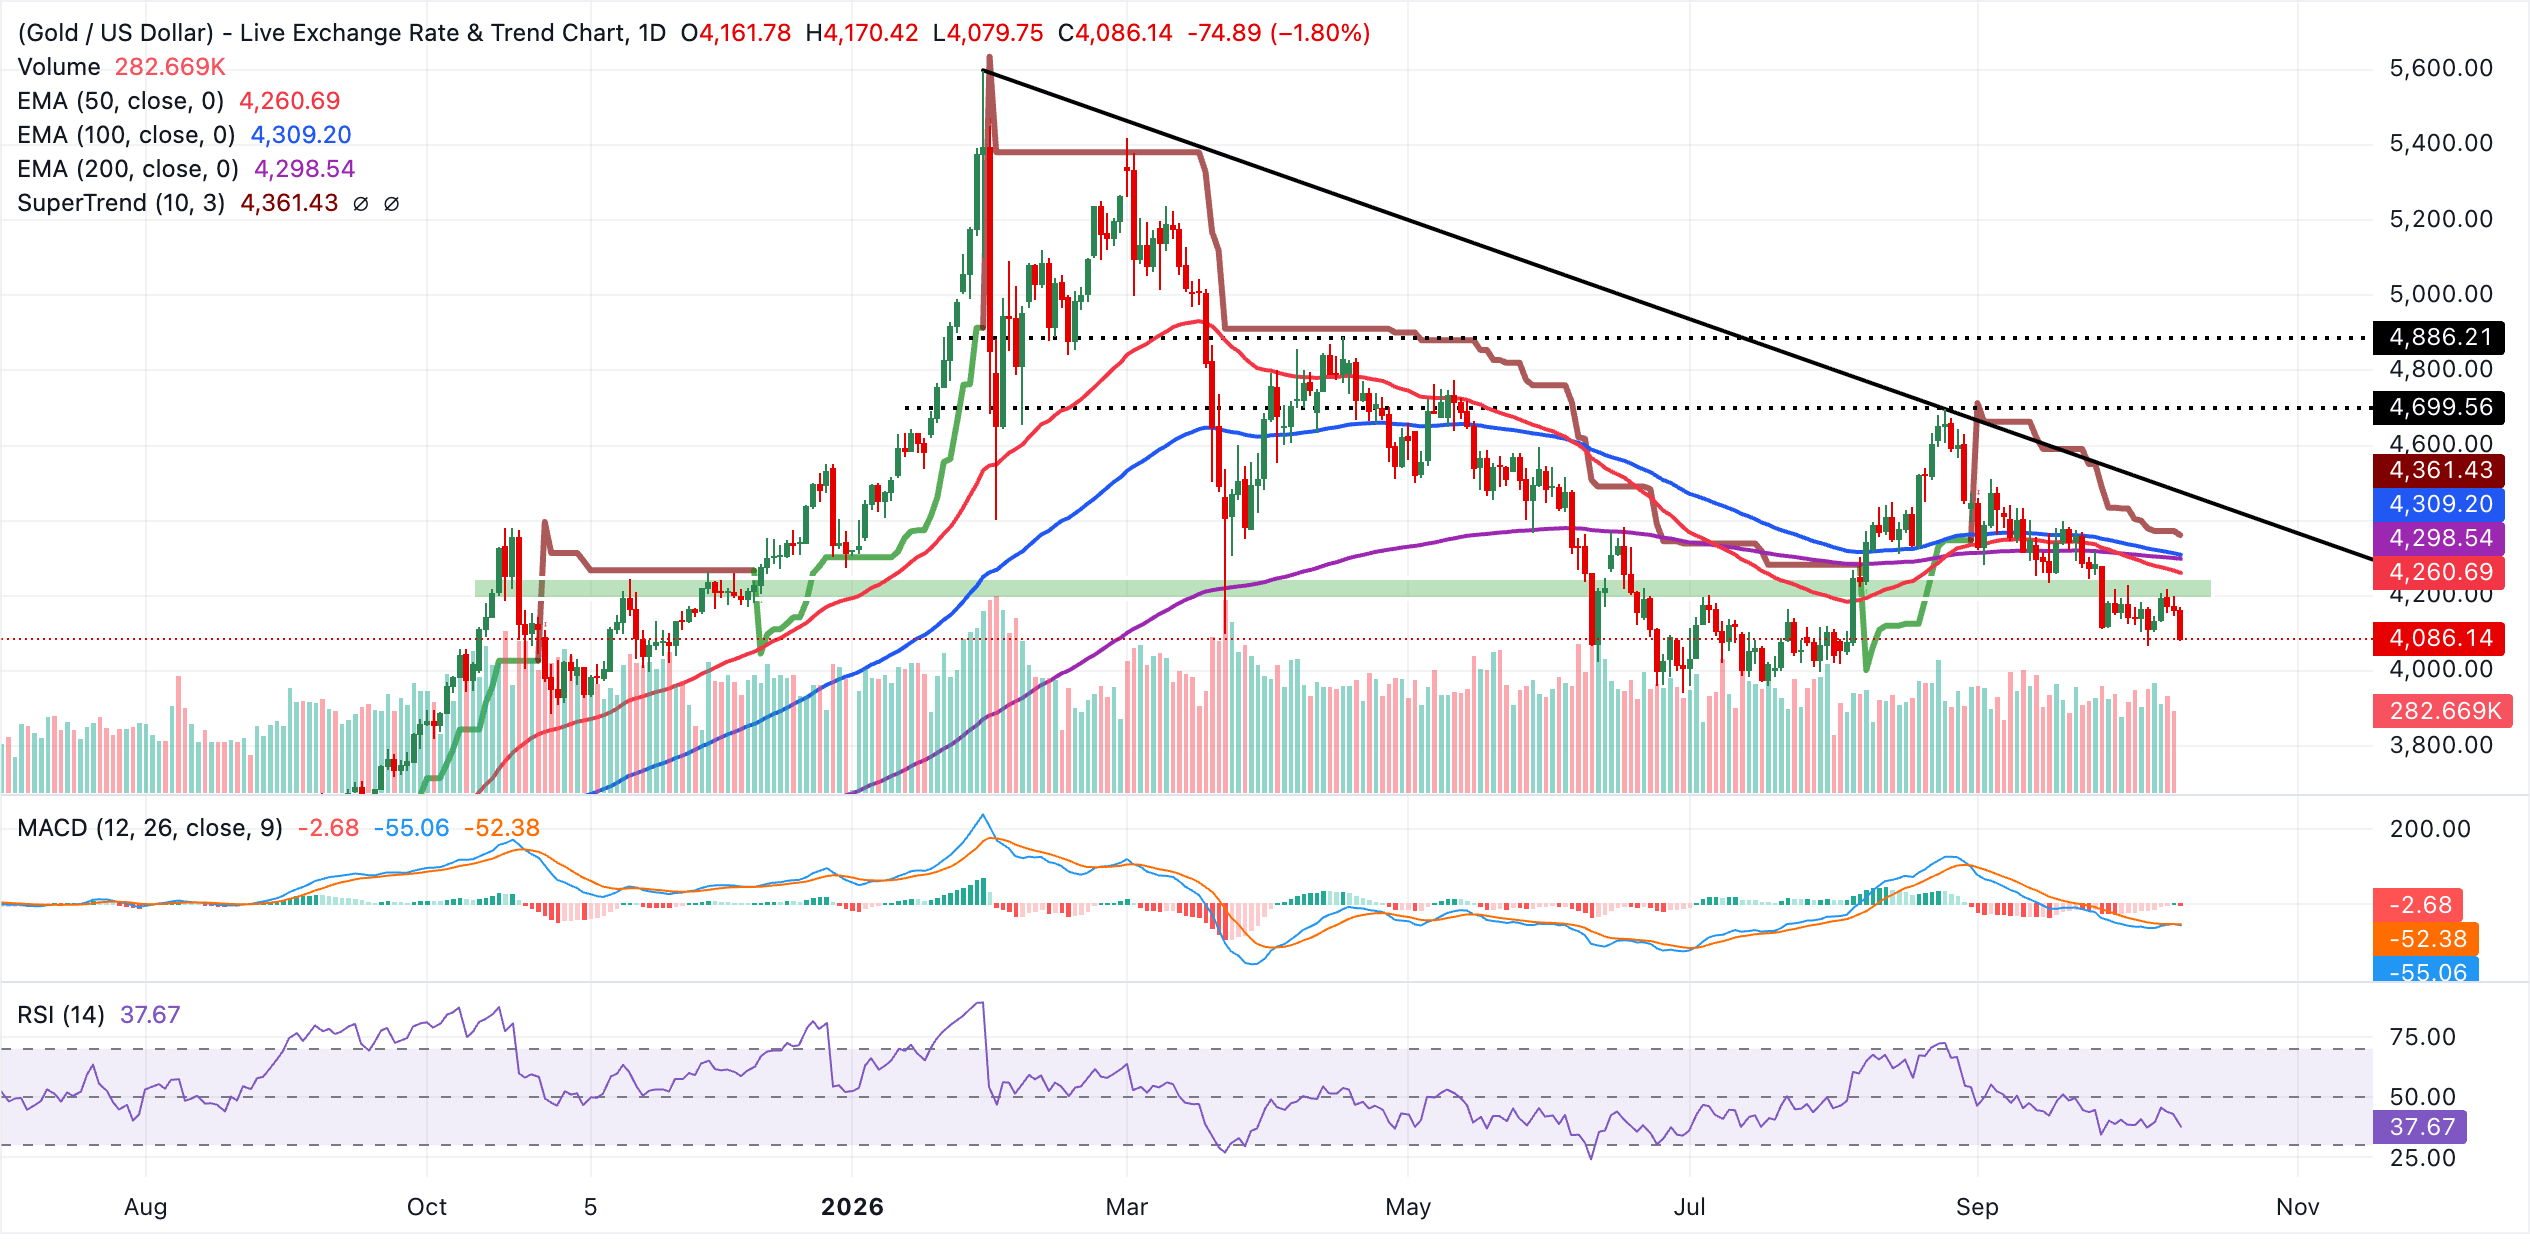
Initial resistance emerges at the 50-day EMA near $4,261, followed by the 200-day EMA at $4,299 and the 100-day EMA at $4,309, which together form a dense overhead supply band. Above that, the SuperTrend barrier at $4,361 and the downtrend resistance line’s break price around $4,425 would be the next levels to watch for a more meaningful recovery.
With no major technical indicators on the daily chart, the metal is effectively trading near a structural low, leaving bears in charge while bulls would need a sustained move back above the clustered EMAs to ease the immediate downside bias.
(The technical analysis of this story was written with the help of an AI tool. Know more.)
Bitcoin, altcoins, stablecoins FAQs
Bitcoin is the largest cryptocurrency by market capitalization, a virtual currency designed to serve as money. This form of payment cannot be controlled by any one person, group, or entity, which eliminates the need for third-party participation during financial transactions.
Altcoins are any cryptocurrency apart from Bitcoin, but some also regard Ethereum as a non-altcoin because it is from these two cryptocurrencies that forking happens. If this is true, then Litecoin is the first altcoin, forked from the Bitcoin protocol and, therefore, an “improved” version of it.
Stablecoins are cryptocurrencies designed to have a stable price, with their value backed by a reserve of the asset it represents. To achieve this, the value of any one stablecoin is pegged to a commodity or financial instrument, such as the US Dollar (USD), with its supply regulated by an algorithm or demand. The main goal of stablecoins is to provide an on/off-ramp for investors willing to trade and invest in cryptocurrencies. Stablecoins also allow investors to store value since cryptocurrencies, in general, are subject to volatility.
Bitcoin dominance is the ratio of Bitcoin's market capitalization to the total market capitalization of all cryptocurrencies combined. It provides a clear picture of Bitcoin’s interest among investors. A high BTC dominance typically happens before and during a bull run, in which investors resort to investing in relatively stable and high market capitalization cryptocurrency like Bitcoin. A drop in BTC dominance usually means that investors are moving their capital and/or profits to altcoins in a quest for higher returns, which usually triggers an explosion of altcoin rallies.
Author

John Isige
FXStreet
John Isige is a seasoned cryptocurrency journalist and markets analyst committed to delivering high-quality, actionable insights tailored to traders, investors, and crypto enthusiasts. He enjoys deep dives into emerging Web3 tren




