The direct impact of tariff announcements on equities and FX

What happened last time?
On Monday, I wrote about how stocks had gone from euphoria in mid-December to panic. Now, we have rinsed the panic move thanks to a seasonal quirk in CPI (January CPI will probably be strong, because that’s how the seasonality has bene working for ages). And we are days away from a potentially apple cart upsetting tariff announcement so the market should probably go back to selling rallies in stocks.
Today, I want to look at the big tariff announcements in 2018/2019 and show you how markets reacted. First, here’s the SPX on the day of the announcement (t) and the 10 subsequent days.
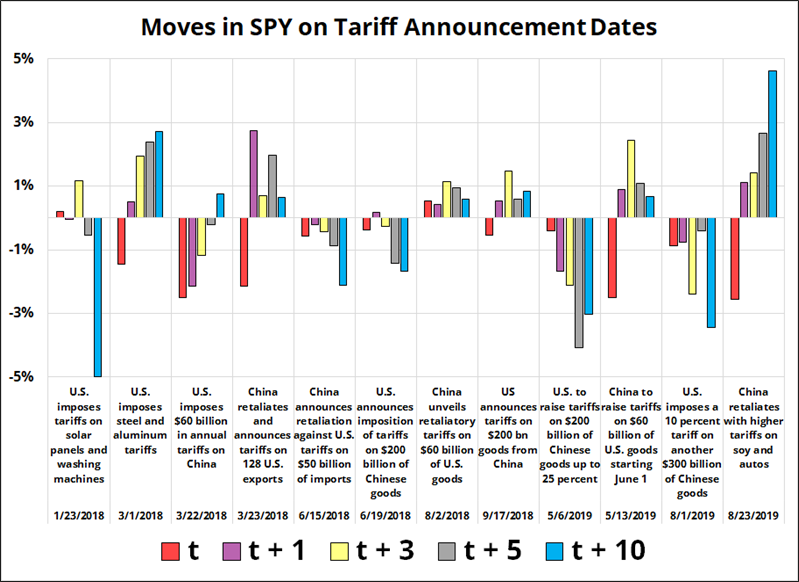
SPX tends to go down on the tariff announcements, though the moves are somewhat short-lived in many cases. There were all kinds of newsflow before and after these announcements, so it’s fair to say these dates are not all clean surprises. There was some speculation ahead of some the announcements that could have dampened the “day of” moves.
The market is not particularly worried about large tariffs, so there is plenty of downside SPX risk next week, especially given the risk that tariffs could be floated or announced when markets are closed on Monday. Either way, I would have some hedges for an announcement early in the week.
One note on scaled tariffs: The initial reaction to scaled but across-the-board tariffs might be: “OK, that’s not too scary” but the market will soon clue in to the fact that stair step tariffs can escalate pretty quickly and hit meaningfully damaging levels fast. I would not treat stair step tariffs as good news for risky assets or bad news for the dollar.
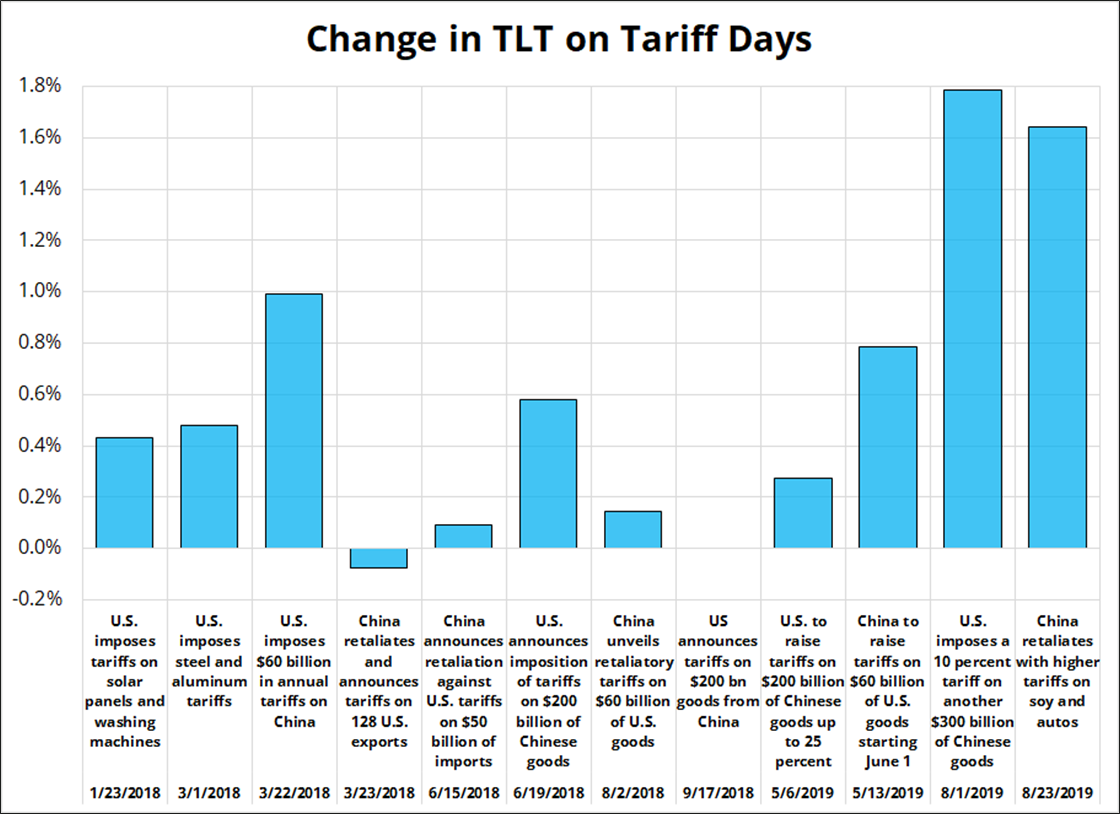
There seems to be this idea that tariffs are inflationary and bad for bonds, but I disagree. I think this is first-order thinking like when people say QE is good for bonds. On the surface, it looks like that’s true, but tariffs are not inflationary in the traditional sense—they are a one-time price shock like a sales tax. Furthermore, tariffs are disruptive to the economy and potentially contractionary if they create uncertainty. Most importantly, though, the empirical evidence shows bonds rallied on most tariff announcement days in 2018/2019.
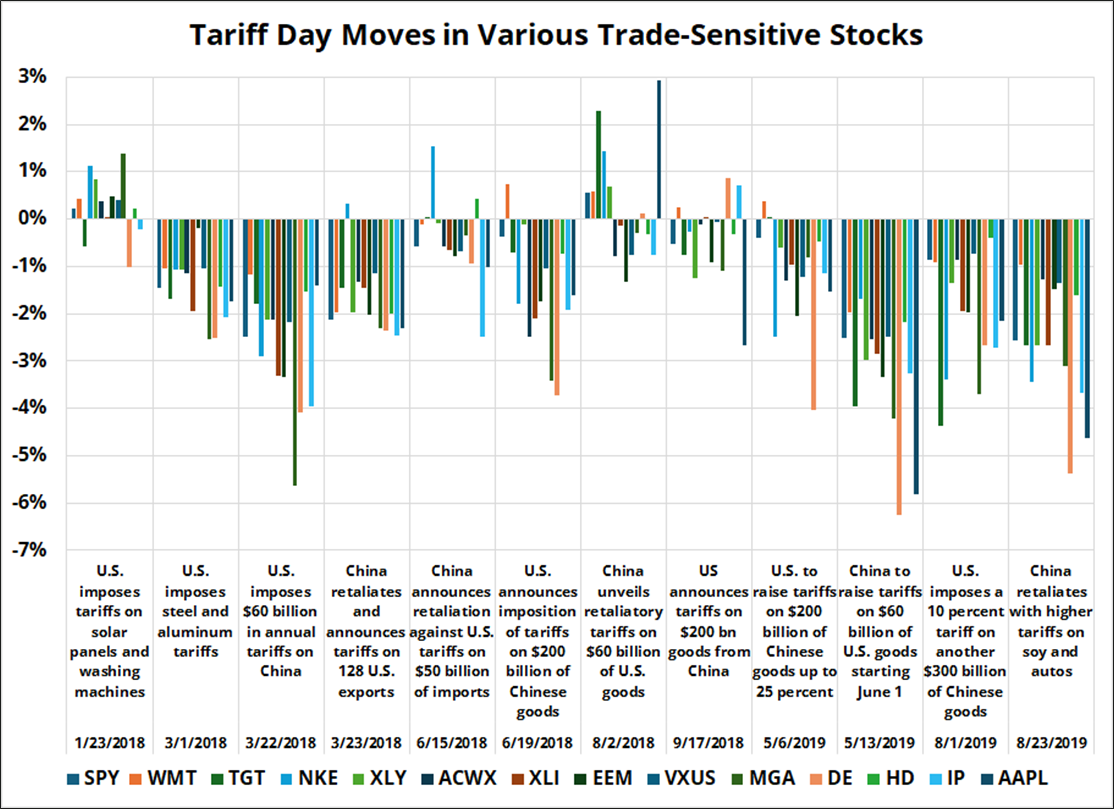
I took a look at 20 stocks that tend to be thought of as tariff sensitive. Stocks like WMT, TGT, HD, DE, NKE, etc. There is no point showing you the individual charts because the moves are quite uniform, if not perfectly identical. Here’s a chart of all of them. You don’t need to see every bar, it’s just to give you a sense of how everything just sells off on Day One.
In FX, the outcomes are predictable and consistent. USDCNH and USDMXN mostly go up, EUR down, USDCAD up, and USDJPY down. That makes sense and translates to cross/JPY lower. Unfortunately, the Bloomberg story overnight about the Bank of Japan has made entry points for any cross/JPY trade less favorable. I might look at cross/JPY downside tomorrow.
Here’s the chart of the FX moves:
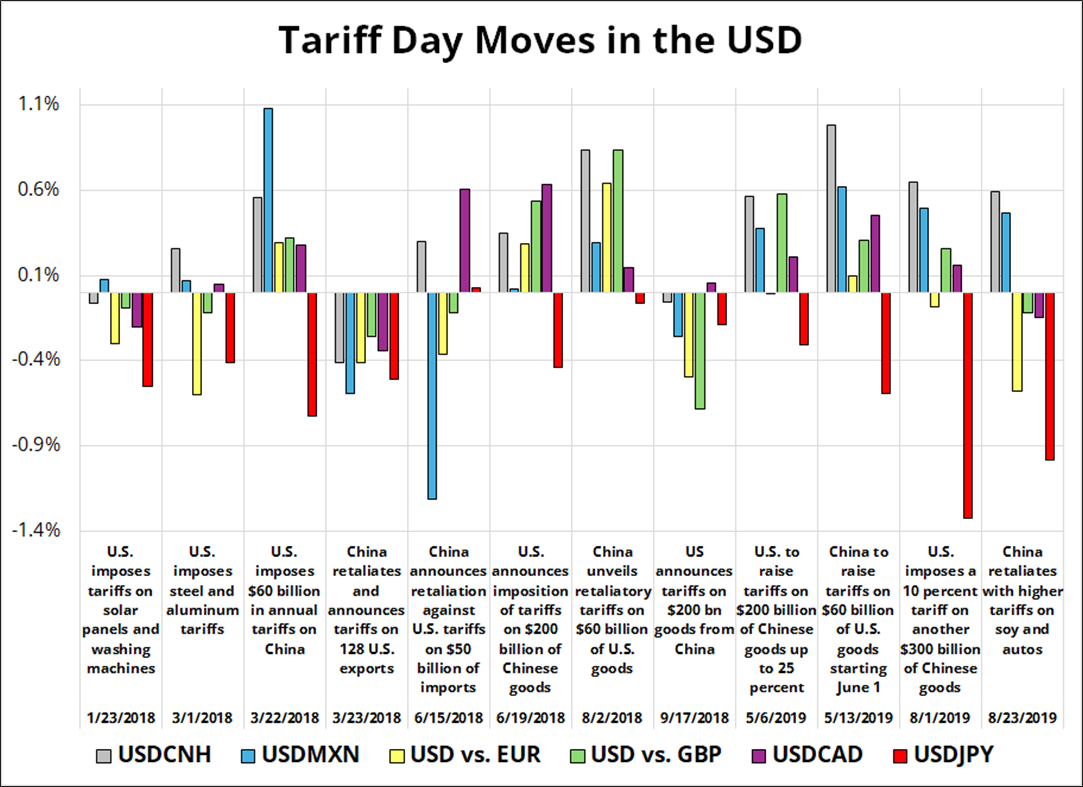
It is important to note that the USDJPY and cross/JPY moves are contingent on the bond move, as cross/JPY listens to yields and not the other way around. So, if you think tariffs are going to be viewed as bond-negative, short cross/JPY is not the answer on large tariffs.
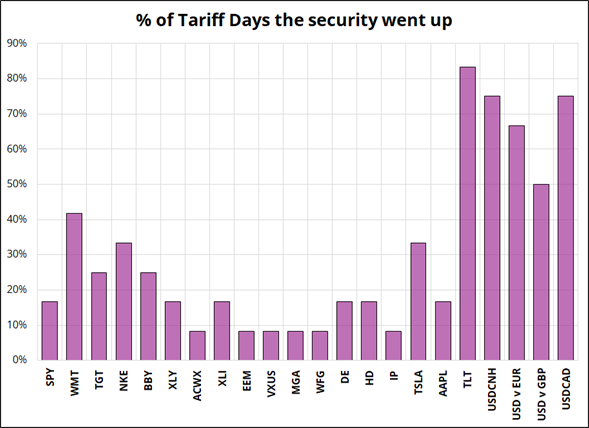
Last two charts I wanted to summarize the reliability of the moves by showing the percentage of days the security went up, and the average move. First chart here and second one on next page.
Note the EM equity ETFs are the most reliable sells, while TLT, USDCAD, and USDCNH are the most reliable buys.
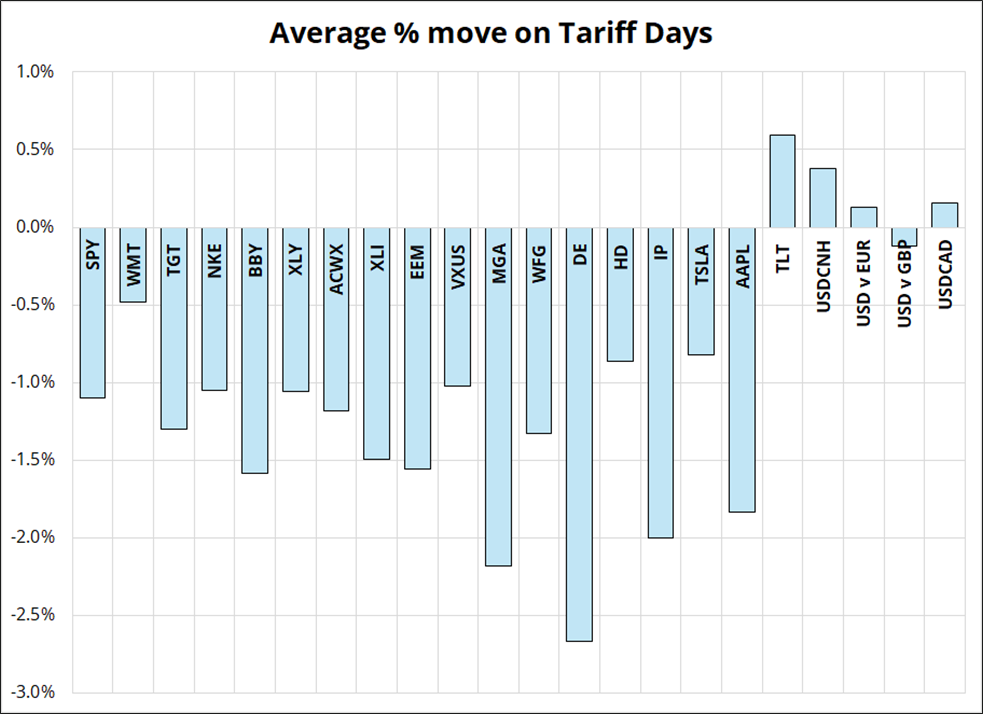
Note the EM equity ETFs are the most reliable sells, while TLT, USDCAD, and USDCNH are the most reliable buys. DE and EEM implied vol are 26 and 16, roughly, so those are two places you might want to have a look. I included MGA because it’s a Canadian auto parts company and thus could be particularly vulnerable this time around, in theory. I was surprised that Walmart wasn’t a great short on tariffs in 2018/2019, given their import dependence and narrow margins.
Author

Brent Donnelly
Spectra Markets
Brent Donnelly is the President of Spectra Markets. He has been trading currencies since 1995 and writing about macro since 2004. Brent is the author of “Alpha Trader” (2021) and “The Art of Currency Trading” (Wiley, 2019).


