|

The Coca-Cola Company (NYSE: KO) Looking to Remain Supported

The Coca-Cola Company (NYSE: KO) is an American multinational corporation and it's the world's leading soft-drink company.

Since February 2019, KO rallied higher within an impulsive 5 waves advance breaking to new all time highs and opening further extension. Down from $56 peak, the stock started a correction lower which is currently unfolding as Double Three Structure which reached the equal legs area $52 – $50 from where buyers are expected to show up to resume the rally within the main bullish trend or provide a 3 waves bounce at least.

KO Daily Chart 11.3.2019

KO

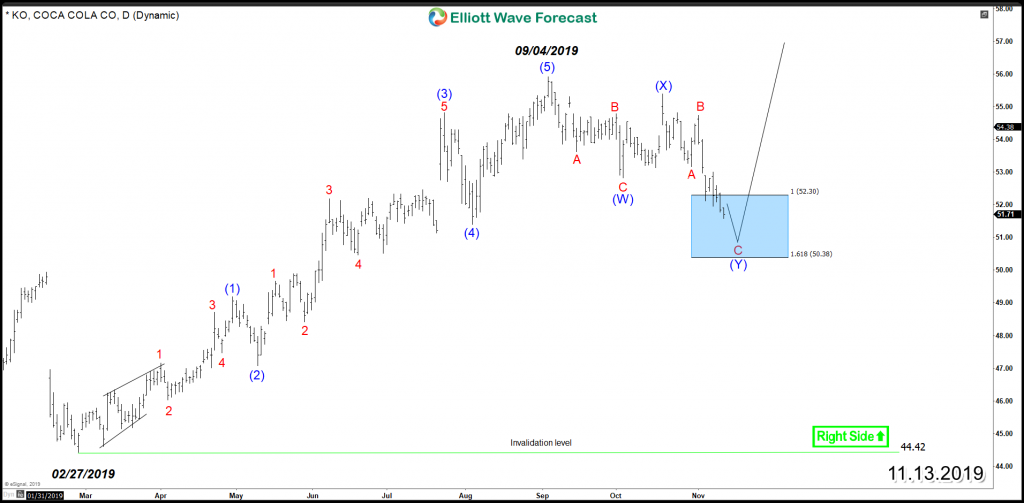
The above blue box is a High-frequency area where the stock is likely to end the cycle because it's a zone used as a hedging area where buyers and sellers agrees on a technical reaction to take place from there allowing the stock to turn . Therefore, as long as the trend remains intact and more importantly $44 low is holding then KO will find support and bounce to the upside.

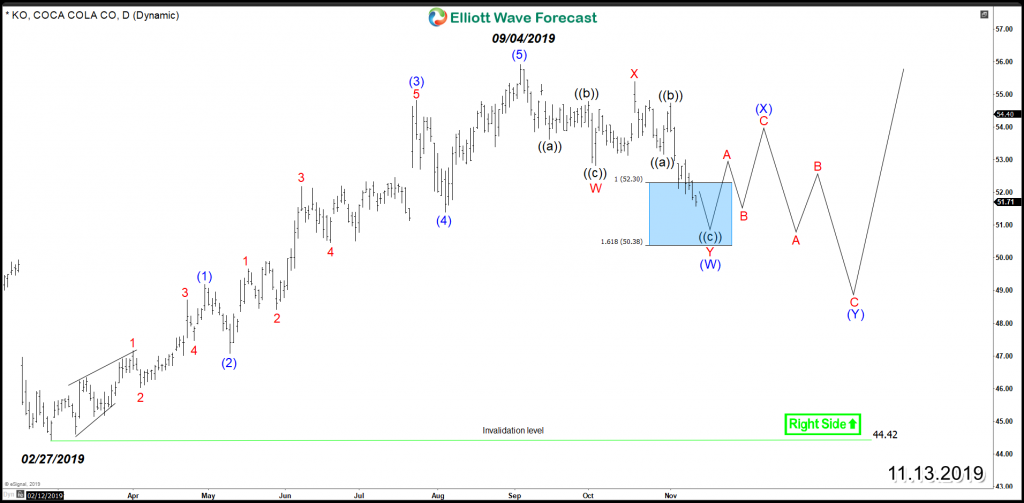
If the expected bounce fail to break to new highs, the stock can still do a 7 swings correction from September peak and find another extreme area later on at lower level before buyers would step in again for another chance to buy it.

KO Daily Chart Double Correction

KO

In Conclusion, KO bullish cycle should remain intact as long as February low is holding and buyers are looking to remain in control because the stock is doing a corrective decline which is expected to presenting buying opportunities before resuming the move to the upside.

Author

Elliott Wave Forecast Team

Elliott Wave Forecast Team

ElliottWave-Forecast.com

More from Elliott Wave Forecast Team
Share:

Editor's Picks

EUR/USD tests nine-day EMA support near 1.1850

EUR/USD inches lower during the Asian hours on Monday, trading around 1.1870 at the time of writing. The 14-day Relative Strength Index momentum indicator at 56 stays above the midline, confirming improving momentum. RSI has cooled from prior overbought readings but stabilizes above 50, suggesting dips could stay limited before buyers reassert control.

GBP/USD flat lines as traders await key UK macro data and FOMC minutes

The GBP/USD pair kicks off a new week on a subdued note and oscillates in a narrow range, just below mid-1.3600s, during the Asian session. Moreover, the mixed fundamental backdrop warrants some caution for aggressive traders as the market focus now shifts to this week's important releases from the UK and the US.

Gold slides below $5,000 amid USD uptick and positive risk tone; downside seems limited

Gold attracts fresh sellers at the start of a new week and reverses a part of Friday's strong move up of over $150 from sub-$4,900 levels. The commodity slides back below the $5,000 psychological mark during the Asian session, though the downside potential seems limited amid a combination of supporting factors.

Bitcoin, Ethereum and Ripple consolidate within key ranges as selling pressure eases

Bitcoin and Ethereum prices have been trading sideways within key ranges following the massive correction. Meanwhile, XRP recovers slightly, breaking above the key resistance zone. The top three cryptocurrencies hint at a potential short-term recovery, with momentum indicators showing fading bearish signs.

Global inflation watch: Signs of cooling services inflation

Realized inflation landed close to expectations in January, as negative base effects weighed on the annual rates. Remaining sticky inflation is largely explained by services, while tariff-driven goods inflation remains limited even in the US.

Ripple Price Forecast: XRP potential bottom could be in sight

Ripple edges up above the intraday low of $1.35 at the time of writing on Friday amid mixed price actions across the crypto market. The remittance token failed to hold support at $1.40 the previous day, reflecting risk-off sentiment amid a decline in retail and institutional sentiment.