The clearest, biggest, and most important reversal in Gold

The implications are so crystal-clear that I’m not sure if it’s even needed to describe them. But I’ll proceed, nonetheless.
The bigger the size of a given formation and the clearer it is, the more important the implications are.
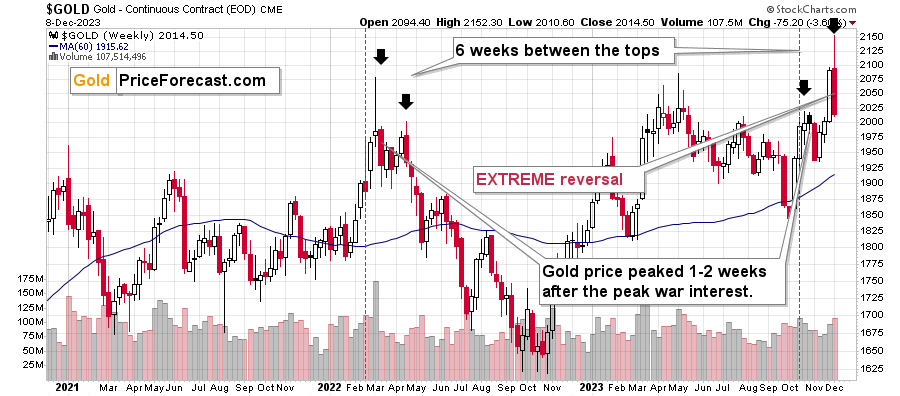
Last week’s reversal in gold was enormous. Gold started the week by soaring to new all-time (nominal only, but still) highs, which was almost immediately followed by a move back down. And what a decline that was!
Gold’s initial upswing of about $60 might seem impressive until one compares it to the ~$140 decline that followed from the top. So, yes, gold ended the week almost $80 lower, crushing the hopes for a confirmed breakout.
Instead of a breakout, we saw a powerful invalidation. And gold didn’t invalidate its breakout to new highs in just intraday terms. It happened also in terms of the daily closing prices and – most importantly – weekly closing prices. Yes, last week, gold closed lower than it had closed in early 2023 at the weekly high.
So, we have a formation that’s enormous, we have massive and super-important invalidations (hey, these were all-time highs!), and it all happened on big volume, which further emphasizes the importance of what happened.
We even have an analogy to the first week of 2021, where gold also reversed in a profound manner. Yes, gold then declined for several weeks in a truly profound manner.
On December 4, when gold was still above the previous all-time-highs, I wrote the following:
Looking at the gold futures chart itself, we see that it just jumped to new nominal highs (in real terms, it hasn’t) in the overnight trading, but it already erased a large portion of that rally, forming a shooting star reversal pattern. Of course, there’s still many hours before the session is over, but the move back down could easily continue from this kind of setup.
Invalidation of the move above the previous highs in gold will serve as a massive sell signal that will be clear for everyone. If you’ve been wondering what could be the trigger for the next huge move lower – gold’s upcoming invalidation is a very likely candidate. The GDXJ-based RSI already provided more than enough of the required context.
Staying focused on what’s likely here based on technical indications is not easy. It’s very difficult. And yet, discipline like that was important during many of our previous trades (and we’re on a streak of 11 realized profitable – unleveraged – trades). It seems that the medium-term decline is about to resume any day or hour now, and that this is likely one of the worst moments to be bullish on mining stocks. The previous moments when GDXJ-based RSI was well above 70 were excellent shorting opportunities, and the same is likely also this time. Stay strong.
Indeed, that was an excellent shorting opportunity.
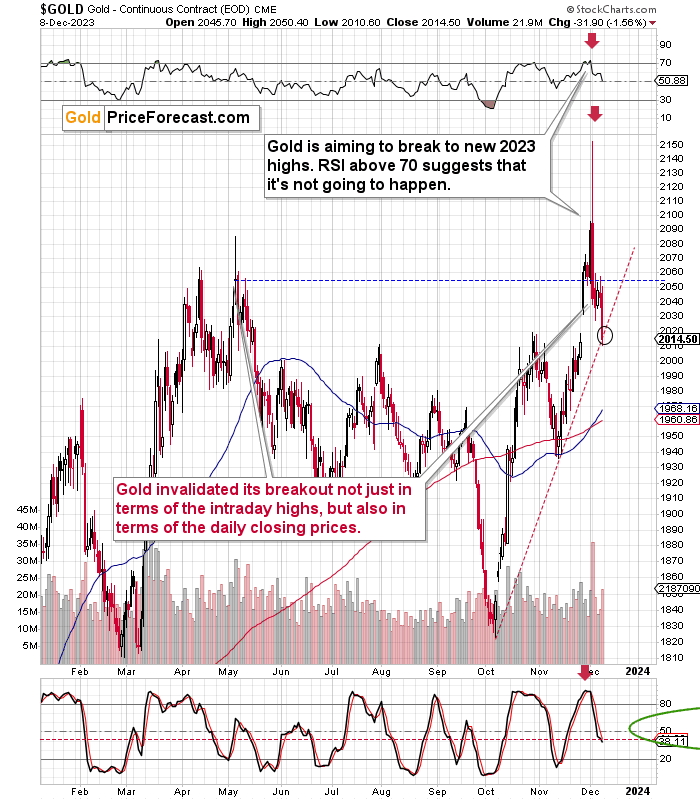
Zooming in allows us to see that gold stopped at its rising support line based on the previous highs. This might (or might not) generate a rebound. Given the importance of the weekly reversal, any rebound here is not likely to be something significant.
Also, the horizontal dashed line marks the previous high in terms of the daily closing prices – it’s obvious that gold closed well below it, invalidating the previous upswing.
Gold is likely to slide here, and mining stocks are likely to slide even more. VERY exciting times ahead!
Want free follow-ups to the above article and details not available to 99%+ investors? Sign up to our free newsletter today!
Want free follow-ups to the above article and details not available to 99%+ investors? Sign up to our free newsletter today!
Author

Przemyslaw Radomski, CFA
Gold Price Forecast
Przemyslaw Radomski, CFA (PR) is a precious metals investor and analyst who takes advantage of the emotionality on the markets, and invites you to do the same. His company, Sunshine Profits, publishes analytical software that any


