The Cartography Corner: July 2025 review

E-Mini S&P 500 futures
In our July 2025 edition of The Cartography Corner, we provided the following analysis of E-Mini S&P 500 Futures:
Support/resistance
For July, the isolated monthly support and resistance levels are as follows:
-
M4: 6935.00.
-
M3: 6591.50.
-
M1: 6523.00.
-
PMH: 6265.50.
-
Close: 6253.75.
-
M2: 6139.00.
-
PML: 5867.50.
-
MTrend: 5788.78.
-
M5: 5727.00.
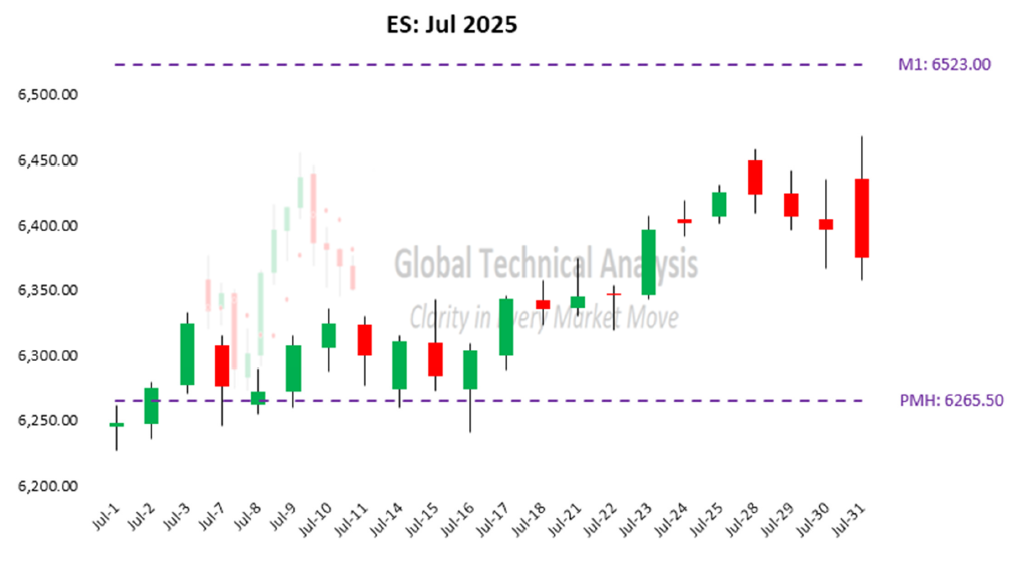
Active traders can use PMH: 6265.50 as the pivot. Traders should maintain a long position above this level and adopt a flat or short position below it.
Figure 1 presents a candlestick chart illustrating daily price movements throughout July 2025. Support and resistance levels, identified through our methodology, are indicated by dashed lines. The market price settled above our isolated pivot at PMH: 6265.50 on the second trading session. Over the following nine trading sessions, that level functioned as support. Though breached intra-session on five occasions, the market price continued to settle above it. Over the final eleven trading sessions, the market price increased but fell short of our identified resistance level at M1: 6523.00. The intra-month high was 6468.50 on July 31.
Figure 1:
US Treasury 30-year yield
In our July 2025 edition of The Cartography Corner, we provided the following analysis of the U.S. Treasury 30- Year Yield:
Support/resistance
For July, the isolated monthly support and resistance levels are as follows:
-
M4: 5.353
-
PMH: 5.004
-
M2: 4.905
-
M1: 4.854
-
MTrend: 4.814
-
Close: 4.782
-
PML: 4.780
-
M3: 4.637
-
M5: 4.406
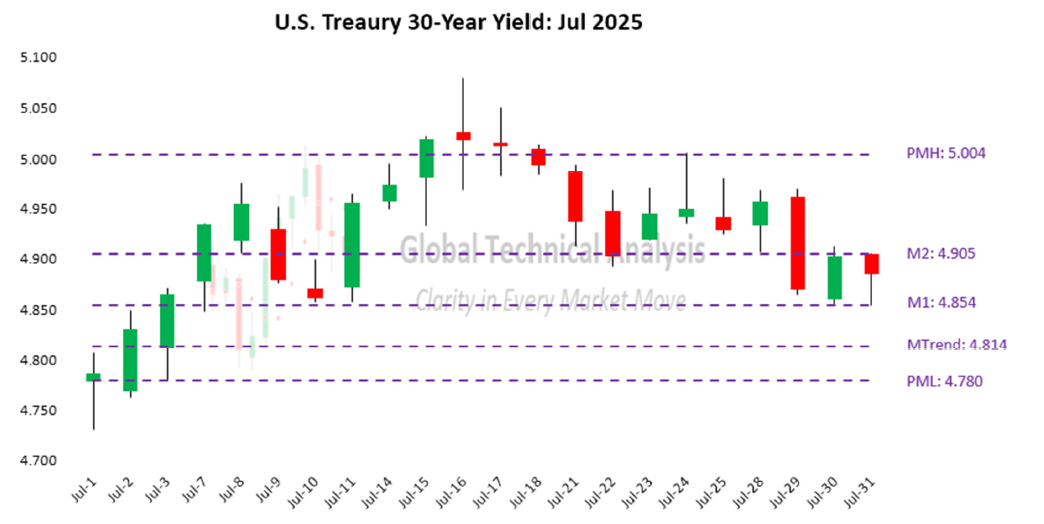
Active traders can use MTrend: 4.814 as the pivot. From a yield perspective, traders should maintain a long position above this level and adopt a flat or short position below it.
Figure 2 presents a candlestick chart illustrating daily price movements throughout July 2025. Support and resistance levels, identified through our methodology, are marked by dashed lines. On the first trading session, the market yield surpassed June’s low yield at PML: 4.780, achieving its monthly objective for July. (Note: The objective of each trading session is to surpass the high and/or low of the previous session.) The intra-month low occurred on July 1 at 4.730. The yield also settled below our identified pivot at MTrend: 4.814. Over the subsequent ten trading sessions, the market yield reversed upward. It breached our identified pivot and resistance levels at MTrend: 4.814, M1: 4.854, and M2: 4.905. This upward movement peaked on July 16, when the yield surpassed June’s high yield at PMH: 5.004, again achieving its monthly objective for July. The intra-month high was recorded at 5.079. Over the final eleven trading sessions, the market yield declined but did not reach our identified pivot level at MTrend: 4.814.
Figure 2:
Author

James Brett Freeze, CFA
Global Technical Analysis
Mr. Freeze has 30 years of experience, having managed capital in both major financial institutions and private investment funds.


