The Bulls Roar…

Good Morning Traders,
As of this writing 4 AM EST, here’s what we see:
US Dollar: Sept. USD is Up at 93.620.
Energies: Sept Crude is Down at 47.36.
Financials: The Sept 30 year bond is Down 18 ticks and trading at 154.19.
Indices: The Sept S&P 500 emini ES contract is 12 ticks Higher and trading at 2466.50.
Gold: The Dec gold contract is trading Down at 1280.10. Gold is 103 ticks Lower than its close.
Initial Conclusion
This is not a correlated market. The dollar is Up+ and Crude is Down- which is normal but the 30 year Bond is trading Lower. The Financials should always correlate with the US dollar such that if the dollar is lower then bonds should follow and vice-versa. The indices are Up+ and Crude is trading Down- which is correlated. Gold is trading Down which is correlated with the US dollar trading Up+. I tend to believe that Gold has an inverse relationship with the US Dollar as when the US Dollar is down, Gold tends to rise in value and vice-versa. Think of it as a seesaw, when one is up the other should be down. I point this out to you to make you aware that when we don’t have a correlated market, it means something is wrong. As traders you need to be aware of this and proceed with your eyes wide open.
At this hour Asia is trading mainly Higher with the exception of the Hang Seng and Singapore exchanges which are trading Lower. At this hour all of Europe is trading Higher.
Possible Challenges To Traders Today
– Core Retail Sales m/m is out at 8:30 AM EST. This is major..
– Retail Sales is out at 8:30 AM EST. This is major.
– Empire State Manufacturing Index is out at 8:30 AM EST. This is major.
– Import Prices m/m are out at 8:30 AM EST. This is major.
– Business Inventories m/m is out at 10 AM EST. This is not major.
– NAHB Housing Market Index is out at 10 AM EST. This is major.
– TIC Long-Term Purchases is out at 4 PM EST
Treasuries
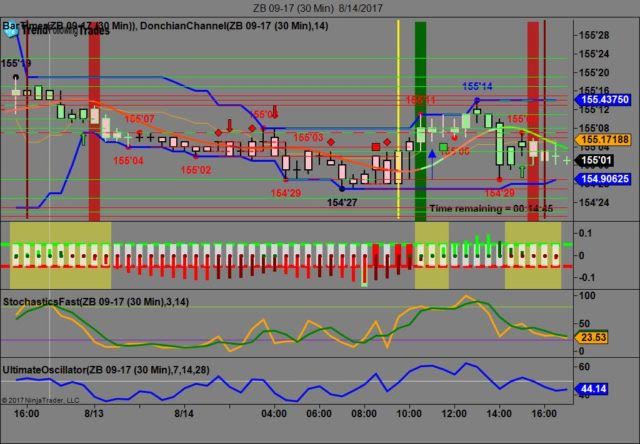
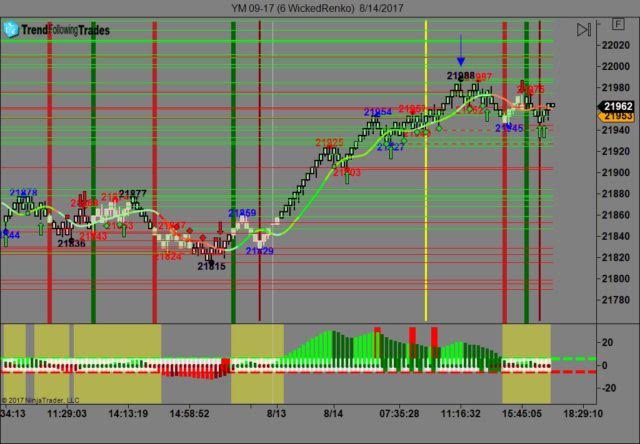
We’ve elected to switch gears a bit and show correlation between the 30 year bond (ZB) and The YM futures contract. The YM contract is the DJIA and the purpose is to show reverse correlation between the two instruments. Remember it’s liken to a seesaw, when up goes up the other should go down and vice versa.
Yesterday the ZB made it’s move at around 11 AM EST with no economic news in sight. The ZB hit a Low at around that time and the YM hit a High. If you look at the charts below ZB gave a signal at around 11 AM and the YM was moving Lower at the same time. Look at the charts below and you’ll see a pattern for both assets. ZB hit a Low at around 11 AM and the YM hit a High. These charts represent the newest version of Trend Following Trades and I’ve changed the timeframe to a 30 minute chart to display better. This represented a long opportunity on the 30 year bond, as a trader you could have netted about 10 plus ticks per contract on this trade. Each tick is worth $31.25. We added a Donchian Channel to the charts to show the signals more clearly. Please note that the front month for the ZB contract is now September, 2017.
Charts Courtesy of Trend Following Trades built on a NinjaTrader platform.
Bias
Yesterday we gave the markets an upside bias and the markets didn’t disappoint as the Dow soared 135 points and the other indices gained ground as well. Today we aren’t dealing with a correlated market however we will maintain an upside bias.
Could this change? Of Course. Remember anything can happen in a volatile market.
Commentary
Well it looks like the political intrigue with North Korea took a back seat yesterday as the markets were keen to rise and rise they did. The Dow gained 135 points and the other indices gained ground as well. The Dow surpassed the 22,000 mark intraday but closed at 21,994 just a tad short of 22K. It seems to me that every few months North Korea rears its ugly head and casts a shadow on the markets. This happened in June, it also happened in April. So for whatever reason it seems to be a never ending theme. Perhaps North Korea isn’t used to someone standing up to them but they should know that they are not the bigger bully. Today we have Retail Sales, Core Retail Sales and this is always major and a proven market mover.
Author

Nick Mastrandrea
Market Tea Leaves


