|

The best trading strategy for Indian Rupees (USD/INR) is still buying dips

The Indian rupee (USDINR) is the official currency of India. The rupee is subdivided into 100 paise (singular: paisa), though as of 2022, coins of denomination of 1 rupee are the lowest value in use whereas 2000 rupees is the highest. The issuance of the currency is controlled by the Reserve Bank of India. The Reserve Bank manages currency in India and derives its role in currency management on the basis of the Reserve Bank of India Act, 1934.

Quarterly USD/INR chart December 2022

Chart

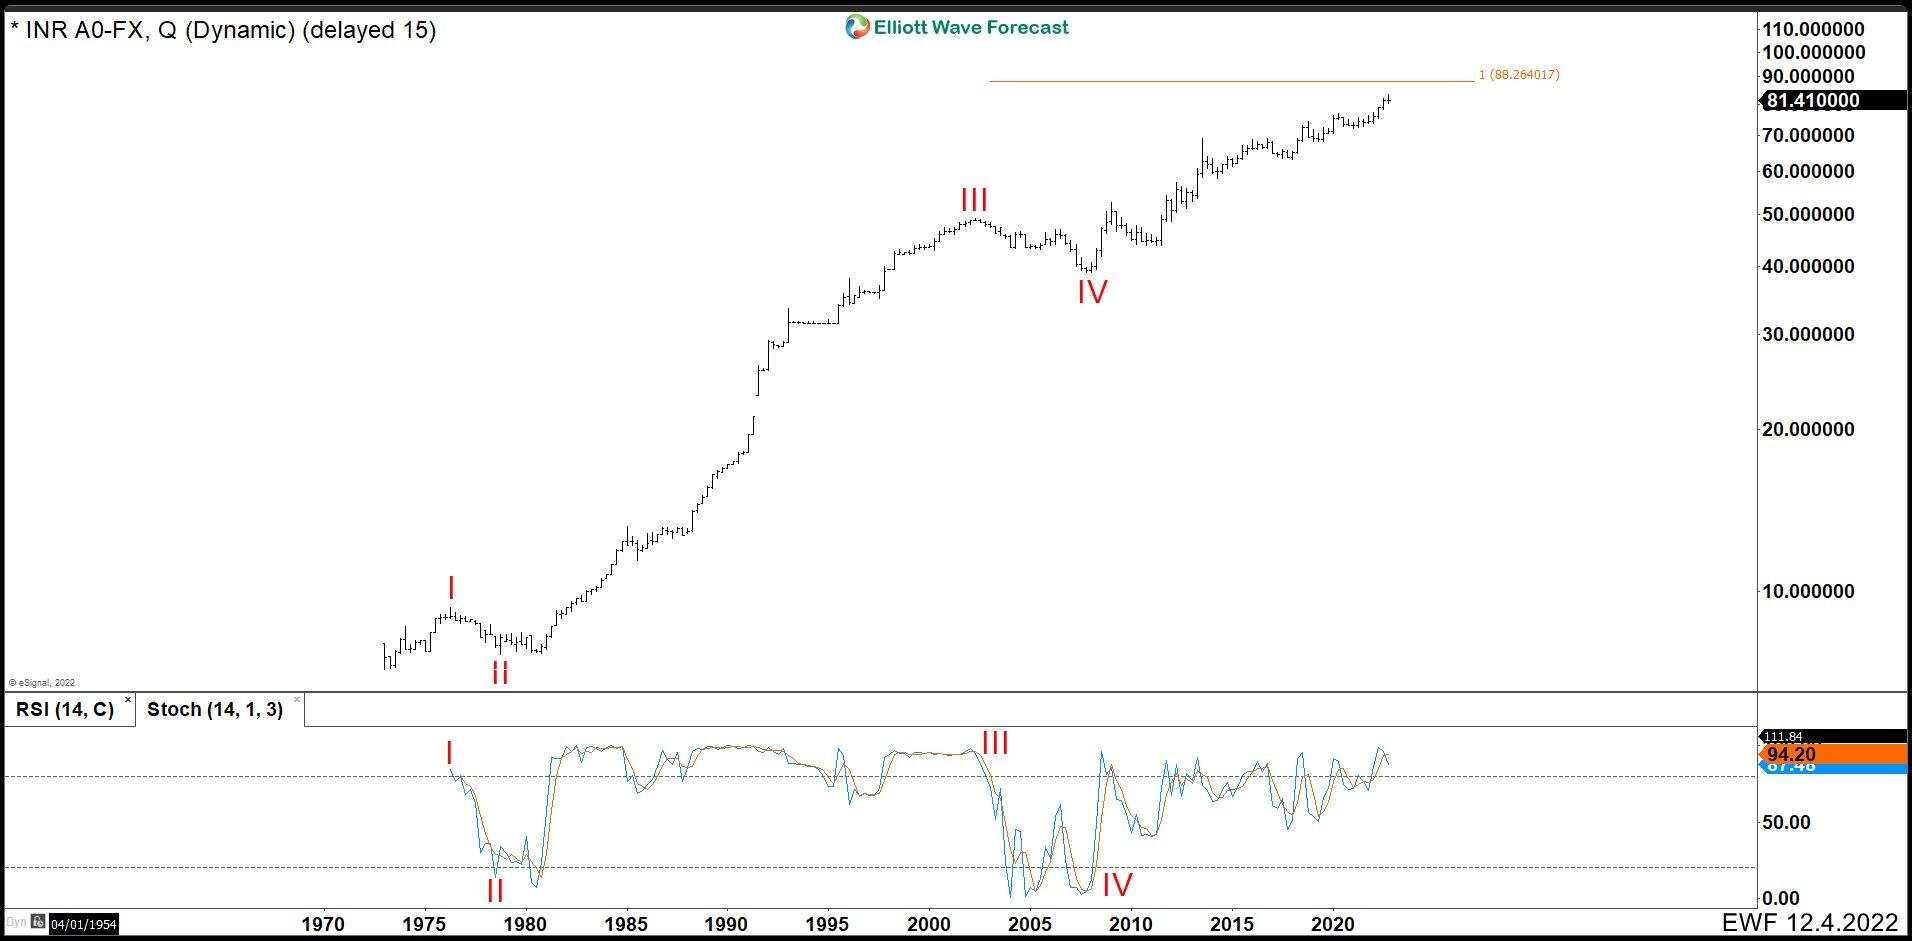
In the quarterly cahrt, we could see USDINR is building an impulse since 1970. Wave (I) ended at 9.35 and pullback as wave (II) finished at 7.66. Then the pair, it had a big rally reached 49.16 as wave III. We could see wave III in the Stoch how in long term kept above 80 until wave IV appeared. Wave IV started at 2002 after Tech’s recession and continued until when Housing’s recession began.  Since 2008, pair extended the rally from 39.01. It is developing a wave (V) that it looks like is not going to end soon. However, we could see an interesting pullback around 88.26 where it is the equal legs taken from wave III and IV.

Monthly USD/INR chart December 2022

Chart

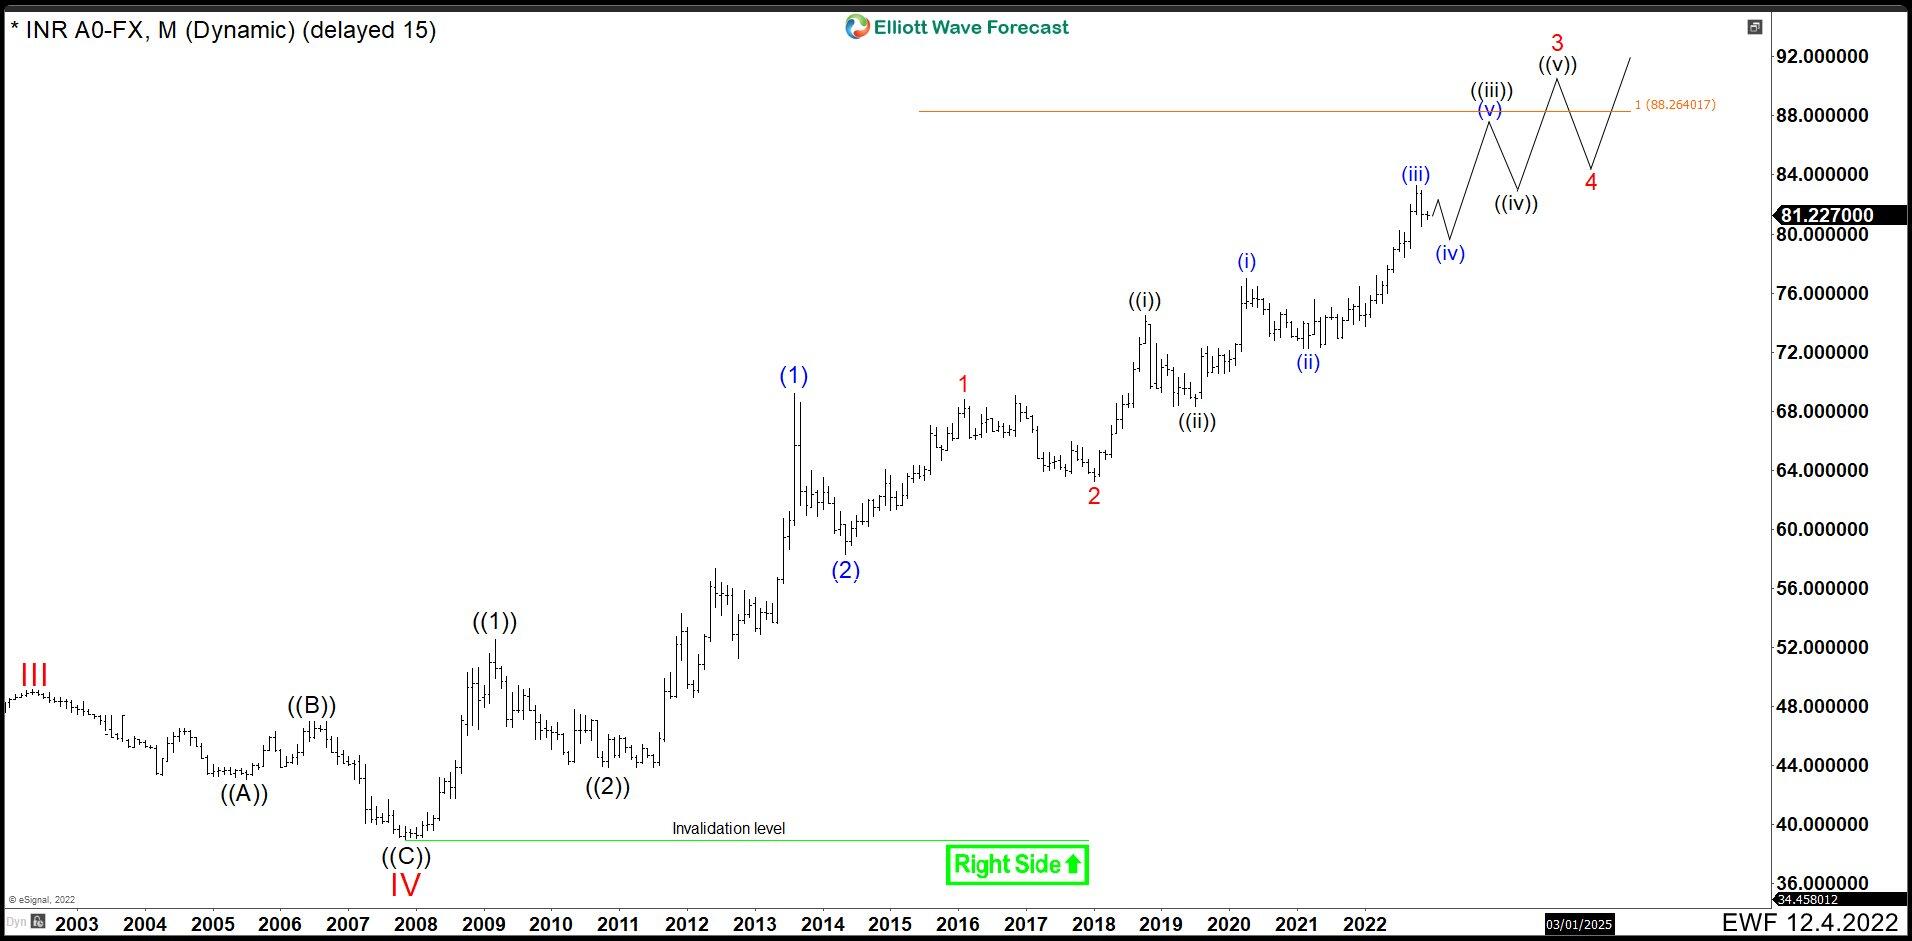
In the monthly chart, we can see that wave ((1)) of V ended at 52.51. Retracement as wave ((2)) of V at 43.88. Since then, the pair has held up in groups of waves 1 and 2 which it should continue to trend. Therefore, the best strategy for the USDINR in the long term, it is to buy dips until it reaches 88.26. From there, wait for a reaction lower to re-enter the market until wave V is completed.

Author

Elliott Wave Forecast Team

Elliott Wave Forecast Team

ElliottWave-Forecast.com

More from Elliott Wave Forecast Team
Share:

Editor's Picks

EUR/USD remains depressed below mid-1.1800s; downside potential seems limited

The EUR/USD pair attracts some sellers for the second consecutive day on Tuesday and hovers below mid-1.1800s amid a relatively quiet trading action during the Asian session. The broader fundamental backdrop, however, warrants some caution for bearish traders before positioning for deeper losses.

When is the UK employment data and how could it affect GBP/USD?

The United Kingdom labor market data for the three months ending December is scheduled to be published today at 07:00 GMT.  GBP/USD trades 0.16% lower to near 1.3610 at the press time. The 20-period Exponential Moving Average slips to 1.3631 and caps rebounds as price holds below the gauge.

Gold downside appears capped ahead of US-Iran talks

Gold is off the lows but remains under moderate selling pressure below the $5,000 threshold early Tuesday. Gold now looks to the US-Iran nuclear deal talks for a fresh trading impetus as US traders return after the long weekend.

Jupiter rises on native SOL staking, TVL rebound

Jupiter edges higher by 3% at press time on Tuesday, approaching the $0.1700 level. The lending protocol announced native staking as collateral, allowing users to borrow against natively staked SOL on certain vaults.

The week ahead: Key inflation readings and why the AI trade could be overdone

It is likely to be a quiet start to the week, with US markets closed on Monday for Presidents Day. European markets are higher across the board and gold is clinging to the $5,000 level after the tamer than expected CPI report in the US reduced haven flows to precious metals.

XRP steadies in narrow range as fund inflows, futures interest rise

Ripple is trading in a narrow range between $1.45 (immediate support) and $1.50 (resistance) at the time of writing on Monday. The remittance token extended its recovery last week, peaking at $1.67 on Sunday from the weekly open at $1.43.