Technical view: BTC/USD emphasising weakness and EUR/USD eyeing higher levels

EUR/USD:
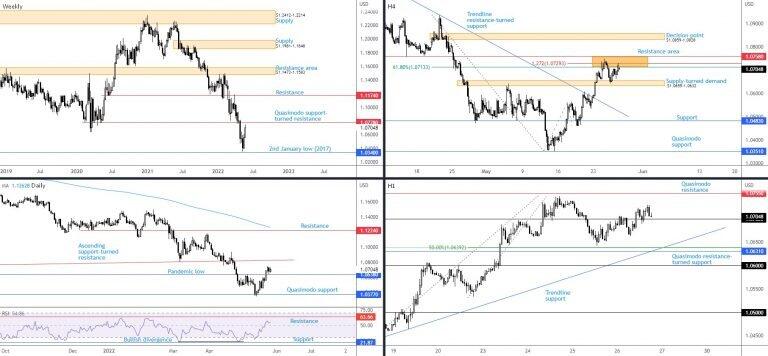
Europe’s shared currency eked out modest gains against the US dollar Thursday, clipping a portion of Wednesday’s 0.5 per cent downside move.
Technically, buyers and sellers continue to square off a touch north of the $1.0638 pandemic low (March 2020) on the daily timeframe, demonstrating scope to connect with an ascending support-turned resistance, drawn from the low $1.0340. Also of technical relevance on the daily chart, the relative strength index (RSI) is exploring ground above its 50.00 centreline (positive momentum). Sharing chart space with the daily ascending line is weekly Quasimodo support-turned resistance at $1.0778. Note that in a market decisively trending lower since 2021 (primary bear trend), $1.0778 is likely to be watched by longer-term sellers.
Shorter-term action has H1 price retesting (and holding) $1.07, with little stopping the pair from reaching for H1 Quasimodo resistance at $1.0755. Therefore, on the back of scope seen for weekly and daily price to push higher, H1 buyers could continue to defend $1.07 and explore north. This implies H4 resistance between $1.0758 and $1.0713 is vulnerable (particularly after failing to engulf H4 supply-turned demand at $1.0655-1.0632).
AUD/USD:
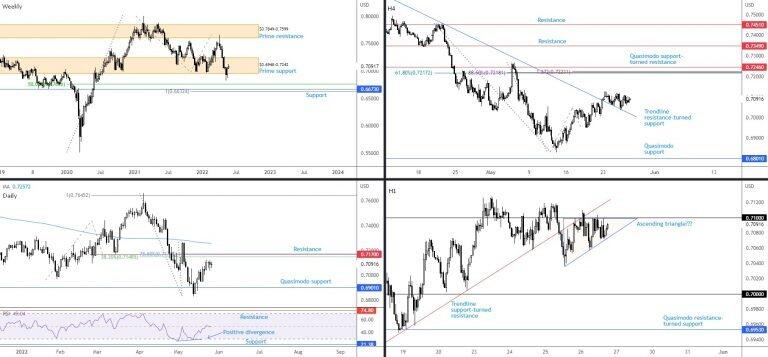
Noted in previous writing, AUD/USD, according to technical chart studies, remains a sellers’ market. With the currency pair echoing a clear downtrend since August 2011 (check monthly scale) and weekly flow topping out at $0.8007 in early February 2021, favourable light is directed towards daily resistance at $0.7170, which accommodates a 78.6% Fibonacci retracement at $0.7174 and a 38.2% Fibonacci retracement at $0.7149. If not tested today, the noted resistance is likely to be watched next week.
H4 trendline resistance-turned support, taken from the high $0.7661, is currently serving buyers relatively well. Upstream on the H4 chart directs attention to resistance made up between $0.7246 and $0.7217 (lower edge derived from a Fibonacci cluster). Though given $0.71 on the H1 chart delivered resistance on Thursday, aided by trendline support-turned resistance, drawn from the low $0.6829, H4 buying could be problematic. Yet, supporting buyers, chart pattern enthusiasts may acknowledge a H1 ascending triangle forming between $0.7036 and $0.7100.
In light of the current trend, $0.71 offers immediate resistance, with a break drawing sellers’ focus to daily resistance at $0.7170. Should $0.71 give way, therefore, a short-term bullish phase could emerge, ultimately targeting the aforesaid daily resistance.
USD/JPY:
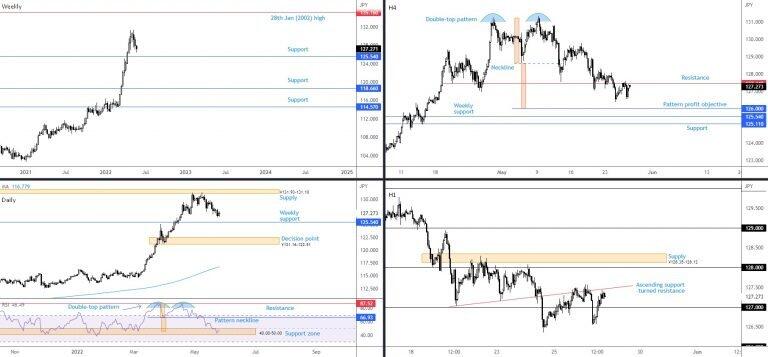
Focus remains on H4 resistance from ¥127.44, bolstered by a local H1 ascending support-turned resistance, pencilled in from the low ¥127.03.
The secondary correction within the primary uptrend (since the beginning of 2021) on the weekly timeframe demonstrates room to extend losses to support from ¥125.54. A similar picture is evident on the daily chart, though it is worth underlining that the relative strength index (RSI) is touching gloves with a familiar area of support between 40.00-50.00 (temporary oversold base since May 2021), together with testing a double-top pattern (87.52) profit objective at 45.83.
Having noted scope to discover deeper water on the bigger picture, and H4 price retesting resistance at ¥127.44, follow-through selling towards ¥126.00 (H4 double-top pattern profit objective) could be seen, set just north of the weekly support base mentioned above at ¥125.54.
GBP/USD:
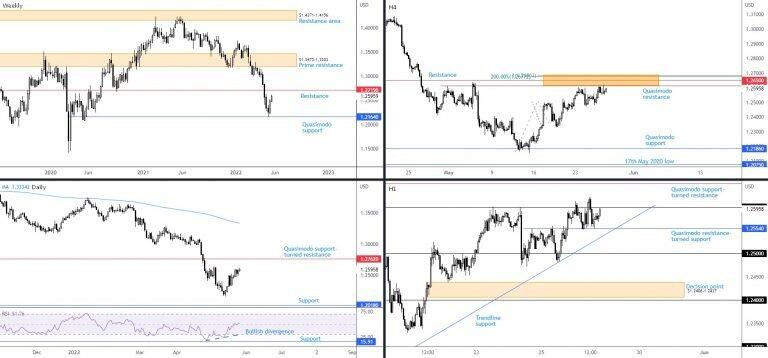
Long term, this market has been entrenched within a strong primary downtrend since early 2021, emphasising weekly resistance at $1.2719 and daily Quasimodo support-turned resistance at $1.2762 as a possible ceiling should price test the base. Interestingly, the daily timeframe’s relative strength index (RSI) is poised to overthrow the 50.00 centreline: positive momentum.
Short term, H1 Quasimodo resistance-turned support at $1.2554 served well Thursday, potentially setting the technical stage for a $1.26 upside breach and possible follow-through to H1 Quasimodo support-turned resistance at $1.2651. In spite of the bigger picture demonstrating some elbowroom to extend the current pullback, H1 buyers attempting to dethrone $1.26 must contend with H4 resistance at $1.2686-$1.2614.
With the above in mind, a H1 close seen above $1.26—followed by a retest that maintains position—could be sufficient to encourage an intraday push to H1 Quasimodo support-turned resistance at $1.2651, closely followed by the $1.27 psychological figure.
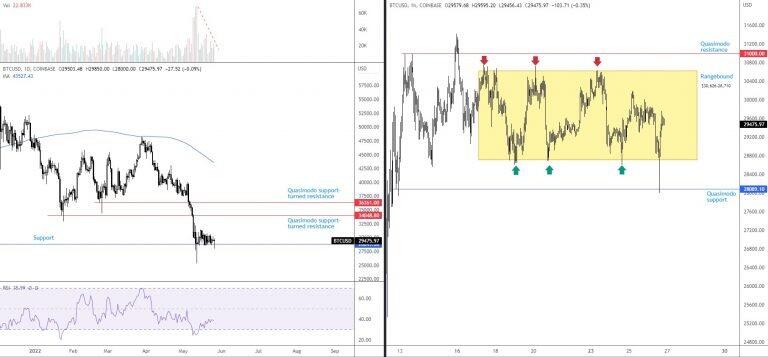
BTC/USD:
As evident from the H1 timeframe, buyers and sellers have been battling for position between $30,626 and $28,710 since 17th May, consequently establishing a clear congestion (consolidation) area. Beyond the aforesaid range, Quasimodo resistance awaits at $31,000 and a Quasimodo support is seen from $28,089, which happened to welcome price in the early hours of US trading on Thursday.
Longer term, the primary trend has been south since topping at $69,000 in November 2021. The daily timeframe’s support from $28,849 has been a talking point since mid-May, though has been unable to motivate buyers. Volume has also observed a decline despite the relative strength index (RSI) rebounding from oversold territory. Daily resistances to note, however, are $36,631 and $34,048, both of which are Quasimodo support-turned resistance barriers.
Going forward, with the trend facing south and daily support ($28,849) offering little, alongside H1 buyers demonstrating a lack of aggressiveness within the current range between $30,626 and $28,710 (unable to test range resistance following latest range support test), sellers could have the upper hand next week. Consequent to this, H1 sellers may begin to seek short setups around current price.
Author

Aaron Hill
FP Markets
After completing his Bachelor’s degree in English and Creative Writing in the UK, and subsequently spending a handful of years teaching English as a foreign language teacher around Asia, Aaron was introduced to financial trading,


