Technical analysis: USD/JPY plunges to 113 mark but bullish structure intact

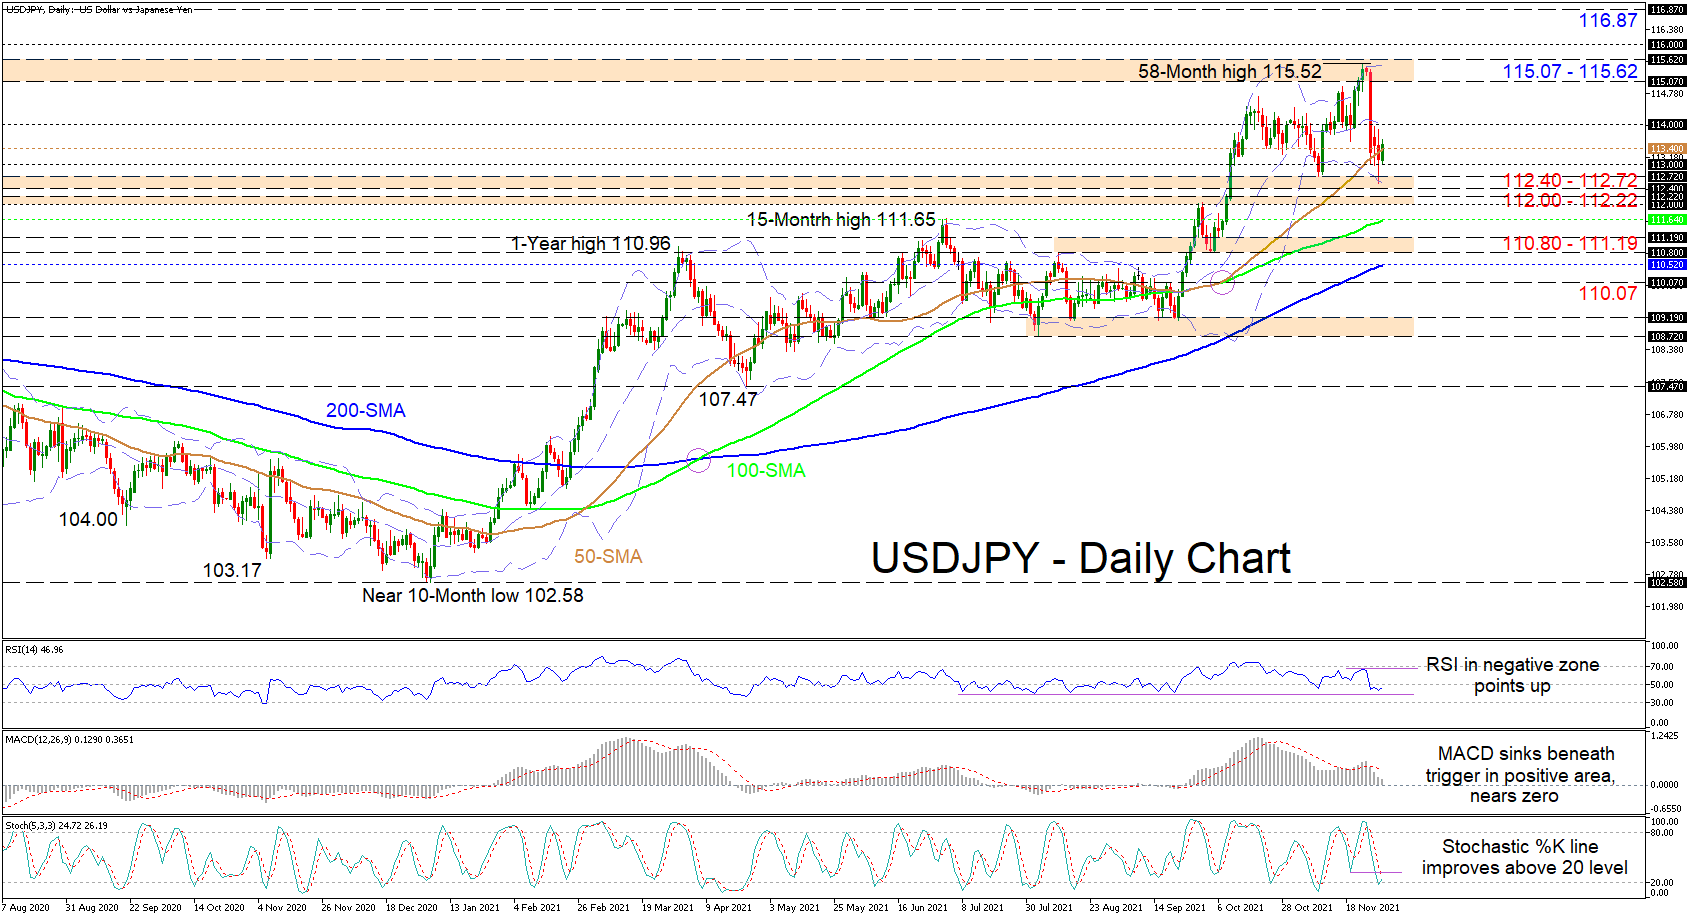
USDJPY has formed a foothold around the 113.00 handle after a selloff in the pair from a near five-year high, which was linked to concerns around the new omicron variant. The aggressive pullback in the pair has failed to cause any significant damage towards the broader uptrend. Furthermore, the rising simple moving averages (SMAs) are also suggesting that the ascent in the pair remains sturdy.
The picture painted by the short-term oscillators is somewhat unclear, as the indicators are conveying mixed messages in directional momentum. The MACD is falling far below its red trigger line and is approaching the zero line. On the other hand, the RSI is improving in the bearish region and looks set to test the 50 level, while the stochastic %K line has pushed back above the 20 level, both signalling that negative pressures are somewhat fading.
If buyers manage to create additional traction and with certainty clearing the 50-day SMA at 113.40, resistance could show its claws around the 114.00 hurdle, where the mid-Bollinger also currently lies. Moving past this obstacle, the price may then tackle the 115.07-115.62 resistance section, which also encapsulates the multi-year high and the upper Bollinger band. Conquering this blockade, the bulls could then meet the 116.00 psychological number before propelling for the 116.87 high, achieved in January 2017.
Otherwise, steering lower involves congested regions of support, starting from the 113.00 border and the 112.40-112.72 barrier, which is reinforced by the lower Bollinger band. Not far below, the 112.00-112.22 boundary could try to impede the drop from gaining pace. However, if a deeper retracement unfolds, the 100-day SMA at 111.64 and the 110.80-111.19 border could act as upside defences. From here, for the pair to surrender more ground, the price would need to pierce below the 200-day SMA and slip past the 110.07 obstacles.
Summarizing, USDJPY’s broader bullish bearing should endure if the price holds above the 112.40-112.72 support zone. Yet, for negative forces to gain an upper hand, the price would need to break beneath the 110.80-111.19 section, once sellers conquer the crammed support obstacles above.
Author

Anthony Charalambous joined XM in 2019 and specializes in preparing daily technical analysis, using his years of trading experience to provide detailed forecasting for all major asset classes such as forex, indices, commodities and equities.


