Technical Analysis – USD/JPY fluctuates near 109.00; capped by 23.6% fibonacci [Video]
![Technical Analysis – USD/JPY fluctuates near 109.00; capped by 23.6% fibonacci [Video]](https://editorial.fxstreet.com/images/Markets/Currencies/Majors/USDJPY/close-up-bank-note-of-japanese-5000-yen-44653096_XtraLarge.jpg)
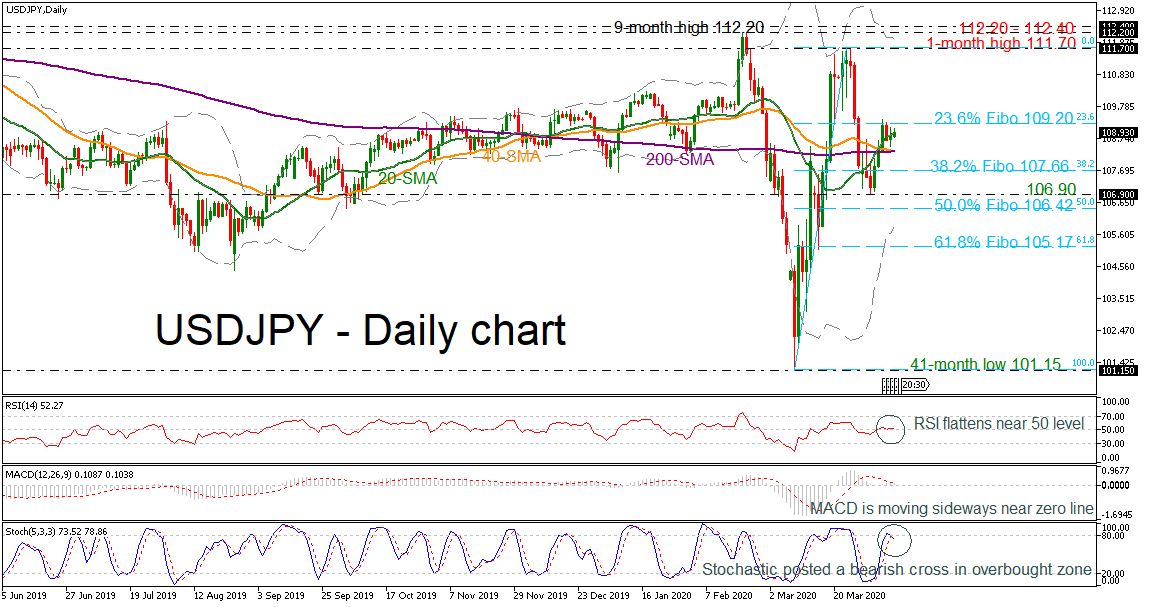
USDJPY recorded a stunning upside rally last month towards a one-month high of 111.70, recouping the previous strong losses to the 41-month low. In the preceding week, though, the pair was on the backfoot before it returned slightly up, and the technical indicators suggest a sideline move in the short-term.
The RSI is currently flattening at its neutral threshold of 50 after an exit from the negative levels, while the MACD is slowing down in positive territory, both hinting that the next move in prices could be sideways. However, stochastics indicate that a downside move again is not far off since the blue % K line formed a bearish cross with the red %D line.
Currently, the price is capped by the 20-day simple moving average (SMA) near the 109.00 round number. Should the market extend losses, support could be met at the 200-day SMA and the 40-day SMA at 108.30 before resting at the 38.2% Fibonacci level of the upward run from 101.15 to 111.70 at 107.66. A significant step below this area could send prices towards the 106.90 support, taken from the latest lows. Then, if the market fails to hold above this level, the next stop could be at the 50.0% Fibonacci of 106.42 and the lower Bollinger Band at 105.90.
On the flip side, if the pair bounces up and surpasses the 23.6% Fibonacci of 109.20, resistance could be met at the one-month peak of 111.70. More increases could drive the pair north towards the 112.20 – 112.40 area, which encapsulates the nine-month high.
In the bigger picture, the pair is negatively aligned but if there is a violation of the 112.20 – 112.40, bulls could take the upper hand, in the short term at least.
Author

Melina joined XM in December 2017 as an Investment Analyst in the Research department. She can clearly communicate market action, particularly technical and chart pattern setups.


