Technical analysis: USD/JPY constricted by MAs but bearish tone yet to dominate

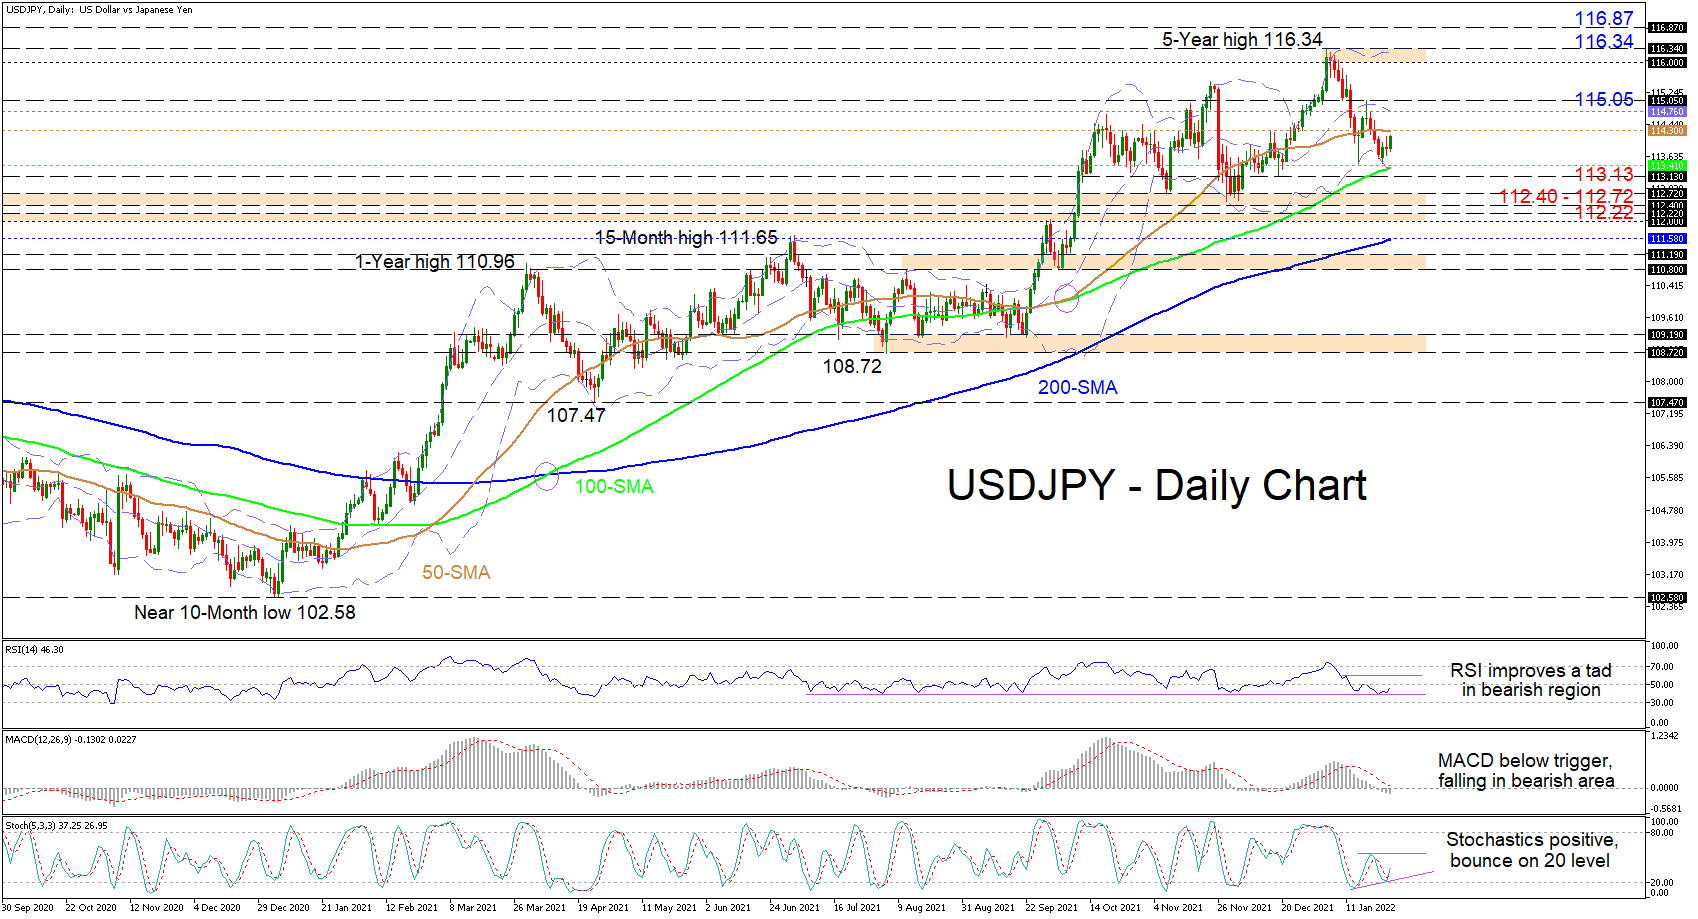
USDJPY is currently being squeezed between the 50- and 100-day simple moving averages (SMAs), also finding its feet on the lower Bollinger band in recent sessions, following the correction from the 5-year high. The longer-term SMAs continue to endorse the broader uptrend, while the slightly weakened incline of the 50-day SMA is reflecting the latest retreat in the pair.
The short-term oscillators are sending mixed messages in directional momentum. The MACD is falling beneath its red trigger and zero lines, while the RSI and the positively charged stochastic oscillator are promoting upside price action in the pair. The RSI is pointing north, nearing its 50 thresholds and the stochastic %K line has rebounded off the 20 oversold levels and over the %D line.
In the positive scenario, preliminary resistance could arise from the capping 50-day SMA at 114.30 ahead of a limiting area, between the mid-Bollinger band at 114.76 and the nearby high of 115.05. Rising beyond these obstacles, the price may then target the 116.00-116.34 zone of resistance. Should buyers overcome this fortified barrier, which includes the upper Bollinger band and the 5-year peak, the 116.87 high, identified in January 2017, could then come under attack.
Otherwise, if the 50-day SMA dismisses any positive developments in the pair, buyers could then try to create a foothold in the space between the 100-day SMA at 113.41 and the 113.13 low. If this region fails to provide the pair with support, the November and December 2021 troughs around 112.72 along with the April 2019 rally peak of 112.40 could forge a strong base. Moreover, the 112.00-112.22 adjacent border, extending back to February 2020, may further fortify upside defenses.
Summarizing, USDJPY has managed to keep the broader uptrend intact above the 112.40-112.72 base. Furthermore, the current neutral-to-bullish tone in the pair is active north of the 100-day SMA at 113.41, and a price jump above 115.05 could fuel optimism. That said, for sellers to reinforce a negative trajectory, they would need to pierce beneath the buffer zone existing from 112.72 until 112.00.
Author

Anthony Charalambous joined XM in 2019 and specializes in preparing daily technical analysis, using his years of trading experience to provide detailed forecasting for all major asset classes such as forex, indices, commodities and equities.


