USD/CAD technical analysis: Tiptoes above 1.20, but bearish picture endures

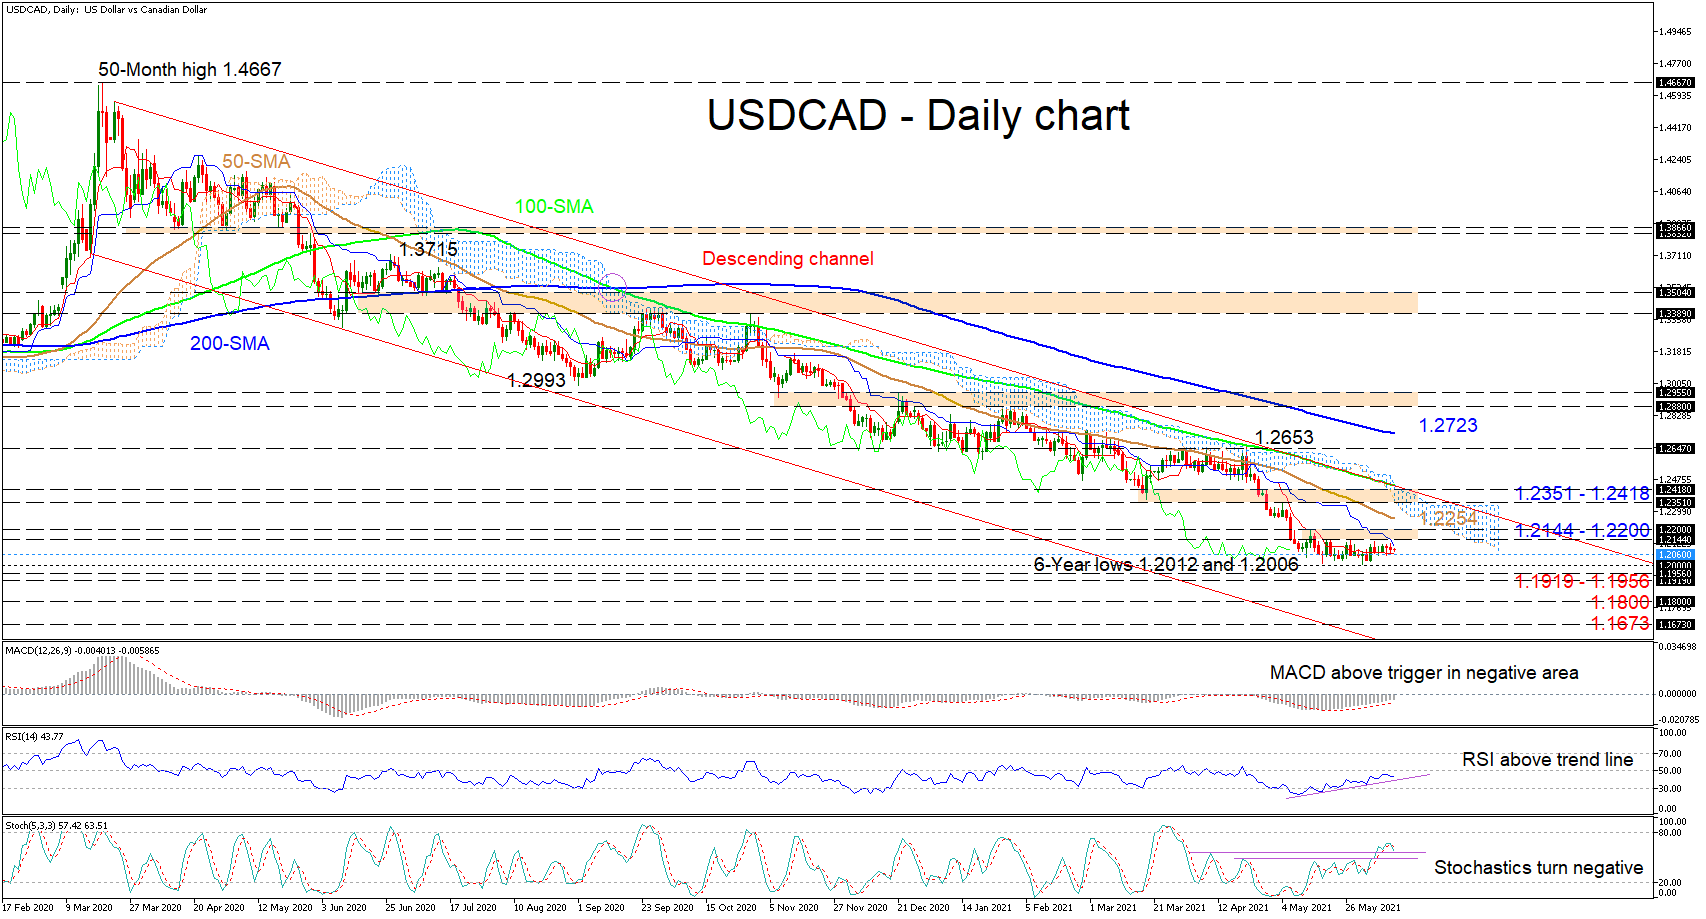
USDCAD is consolidating around the level of 1.2060, which happens to be a key trough achieved in early September 2017, after its most recent deflection off the upper frontier of the descending channel. The bearish simple moving averages (SMAs) are still weighing on the pair that has ticked to 6-year lows of 1.2012 and 1.2006, near the 1.2000 barriers, where the price seems to have shaped a floor.
Although the red Tenkan-sen line is reflecting a dry-up in negative impetus, the short-term oscillators are transmitting debatable signals in terms of sustainable positive momentum. The MACD is climbing above its red trigger line in the negative region, while the RSI is stalling in bearish territory, above the trend line. The positive charge in the stochastic oscillator has faded, though negative backing for price deterioration has yet to be confirmed.
To the downside, if sellers break below the hardened floor at 1.2000, early friction could arise from the nearby support section of 1.1919-1.1956. Plunging from here, the pair may then target the 1.1800 handles; however, if selling interest retains the upper hand, the 1.1673 barrier - identified in mid-December of 2014 - could come between the price and the lower band of the bearish pattern.
If buyers re-emerge, initial resistance may transpire from 1.2144-1.2200, an area formed between recent highs of the latest minor consolidation. Moving higher, the 50-day SMA at 1.2254 and the Ichimoku cloud may attempt to impede the pair from challenging the 1.2351-1.2418 buffer zone, which is overlapped by the upper boundary of the channel.
Summarizing, USDCAD maintains a strong bearish bias as it adheres to the bearish channel. A break below the 6-year lows and the 1.2000 marks could boost this bias, while a shift above the 1.2351-1.2418 boundary could underpin price optimism.
Author

Anthony Charalambous joined XM in 2019 and specializes in preparing daily technical analysis, using his years of trading experience to provide detailed forecasting for all major asset classes such as forex, indices, commodities and equities.


